White/Caucasian vs Brazilian Self-Care Disability
COMPARE
White/Caucasian
Brazilian
Self-Care Disability
Self-Care Disability Comparison
Whites/Caucasians
Brazilians
2.6%
SELF-CARE DISABILITY
4.4/ 100
METRIC RATING
216th/ 347
METRIC RANK
2.3%
SELF-CARE DISABILITY
99.3/ 100
METRIC RATING
65th/ 347
METRIC RANK
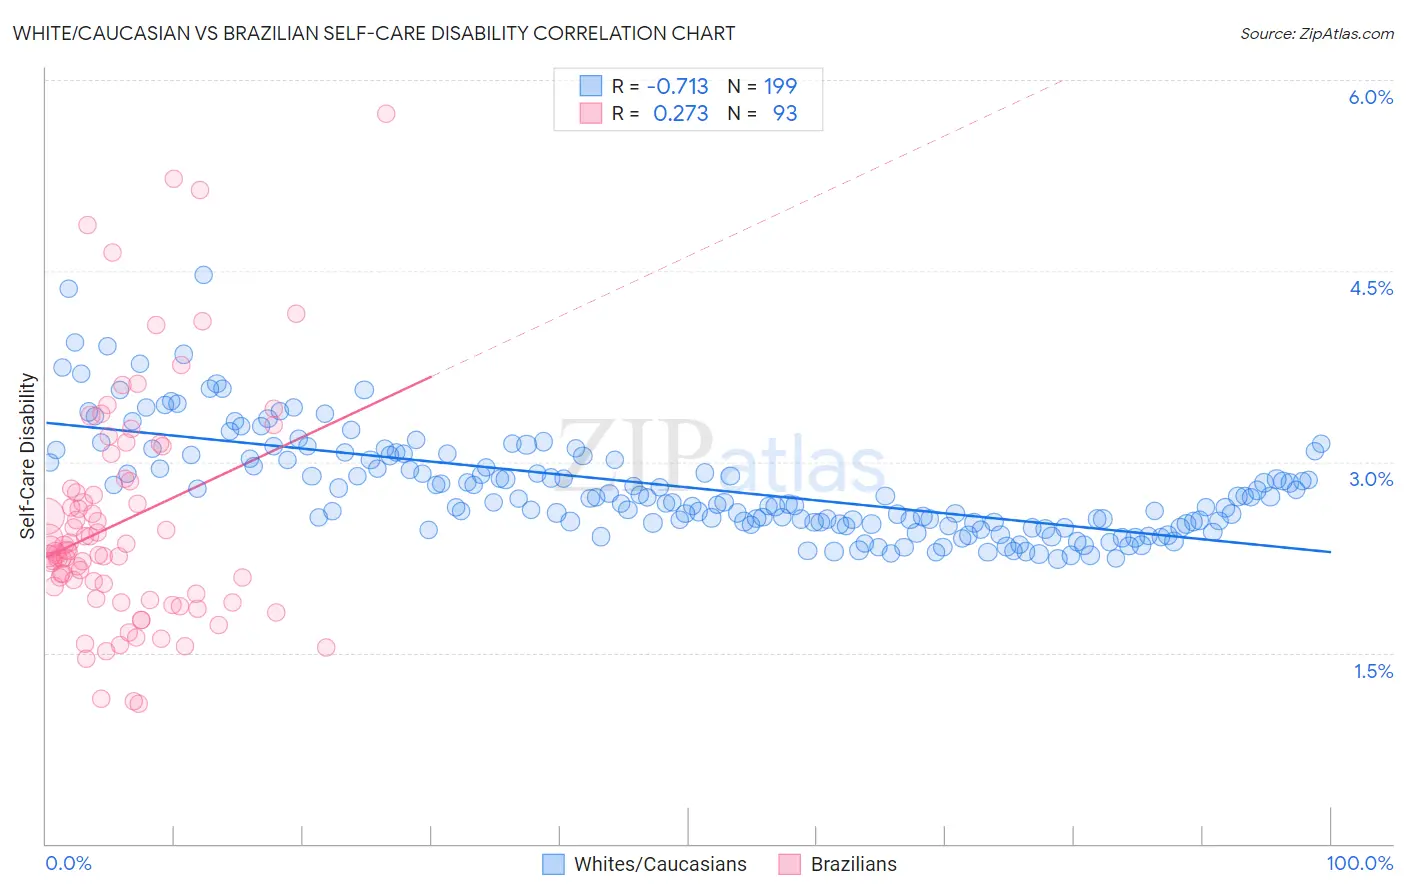
White/Caucasian vs Brazilian Self-Care Disability Correlation Chart
The statistical analysis conducted on geographies consisting of 580,250,955 people shows a strong negative correlation between the proportion of Whites/Caucasians and percentage of population with self-care disability in the United States with a correlation coefficient (R) of -0.713 and weighted average of 2.6%. Similarly, the statistical analysis conducted on geographies consisting of 323,606,660 people shows a weak positive correlation between the proportion of Brazilians and percentage of population with self-care disability in the United States with a correlation coefficient (R) of 0.273 and weighted average of 2.3%, a difference of 10.2%.
Self-Care Disability Correlation Summary
| Measurement | White/Caucasian | Brazilian |
| Minimum | 2.2% | 1.1% |
| Maximum | 4.5% | 5.7% |
| Range | 2.2% | 4.6% |
| Mean | 2.8% | 2.5% |
| Median | 2.7% | 2.3% |
| Interquartile 25% (IQ1) | 2.5% | 1.9% |
| Interquartile 75% (IQ3) | 3.0% | 2.9% |
| Interquartile Range (IQR) | 0.53% | 0.91% |
| Standard Deviation (Sample) | 0.41% | 0.90% |
| Standard Deviation (Population) | 0.41% | 0.90% |
Similar Demographics by Self-Care Disability
Demographics Similar to Whites/Caucasians by Self-Care Disability
In terms of self-care disability, the demographic groups most similar to Whites/Caucasians are Immigrants from Thailand (2.6%, a difference of 0.020%), Celtic (2.6%, a difference of 0.020%), Ecuadorian (2.6%, a difference of 0.070%), Immigrants from Honduras (2.6%, a difference of 0.070%), and Scotch-Irish (2.6%, a difference of 0.090%).
| Demographics | Rating | Rank | Self-Care Disability |
| Malaysians | 7.7 /100 | #209 | Tragic 2.5% |
| Panamanians | 6.4 /100 | #210 | Tragic 2.5% |
| Native Hawaiians | 5.1 /100 | #211 | Tragic 2.6% |
| Samoans | 5.1 /100 | #212 | Tragic 2.6% |
| Ecuadorians | 4.7 /100 | #213 | Tragic 2.6% |
| Immigrants | Honduras | 4.7 /100 | #214 | Tragic 2.6% |
| Immigrants | Thailand | 4.5 /100 | #215 | Tragic 2.6% |
| Whites/Caucasians | 4.4 /100 | #216 | Tragic 2.6% |
| Celtics | 4.4 /100 | #217 | Tragic 2.6% |
| Scotch-Irish | 4.1 /100 | #218 | Tragic 2.6% |
| Immigrants | Moldova | 4.0 /100 | #219 | Tragic 2.6% |
| Sub-Saharan Africans | 4.0 /100 | #220 | Tragic 2.6% |
| Hondurans | 3.8 /100 | #221 | Tragic 2.6% |
| Spaniards | 3.8 /100 | #222 | Tragic 2.6% |
| French Canadians | 3.8 /100 | #223 | Tragic 2.6% |
Demographics Similar to Brazilians by Self-Care Disability
In terms of self-care disability, the demographic groups most similar to Brazilians are Immigrants from Argentina (2.3%, a difference of 0.030%), Swedish (2.3%, a difference of 0.060%), South African (2.3%, a difference of 0.060%), Mongolian (2.3%, a difference of 0.070%), and Immigrants from Zaire (2.3%, a difference of 0.15%).
| Demographics | Rating | Rank | Self-Care Disability |
| Immigrants | Cameroon | 99.6 /100 | #58 | Exceptional 2.3% |
| New Zealanders | 99.5 /100 | #59 | Exceptional 2.3% |
| Immigrants | Japan | 99.5 /100 | #60 | Exceptional 2.3% |
| Palestinians | 99.4 /100 | #61 | Exceptional 2.3% |
| Egyptians | 99.4 /100 | #62 | Exceptional 2.3% |
| Mongolians | 99.3 /100 | #63 | Exceptional 2.3% |
| Swedes | 99.3 /100 | #64 | Exceptional 2.3% |
| Brazilians | 99.3 /100 | #65 | Exceptional 2.3% |
| Immigrants | Argentina | 99.3 /100 | #66 | Exceptional 2.3% |
| South Africans | 99.3 /100 | #67 | Exceptional 2.3% |
| Immigrants | Zaire | 99.2 /100 | #68 | Exceptional 2.3% |
| Immigrants | Norway | 99.2 /100 | #69 | Exceptional 2.3% |
| Immigrants | Northern Europe | 99.2 /100 | #70 | Exceptional 2.3% |
| Asians | 99.2 /100 | #71 | Exceptional 2.3% |
| Eastern Europeans | 99.2 /100 | #72 | Exceptional 2.3% |