White/Caucasian vs Brazilian Poverty
COMPARE
White/Caucasian
Brazilian
Poverty
Poverty Comparison
Whites/Caucasians
Brazilians
12.3%
POVERTY
55.4/ 100
METRIC RATING
169th/ 347
METRIC RANK
11.9%
POVERTY
79.7/ 100
METRIC RATING
143rd/ 347
METRIC RANK
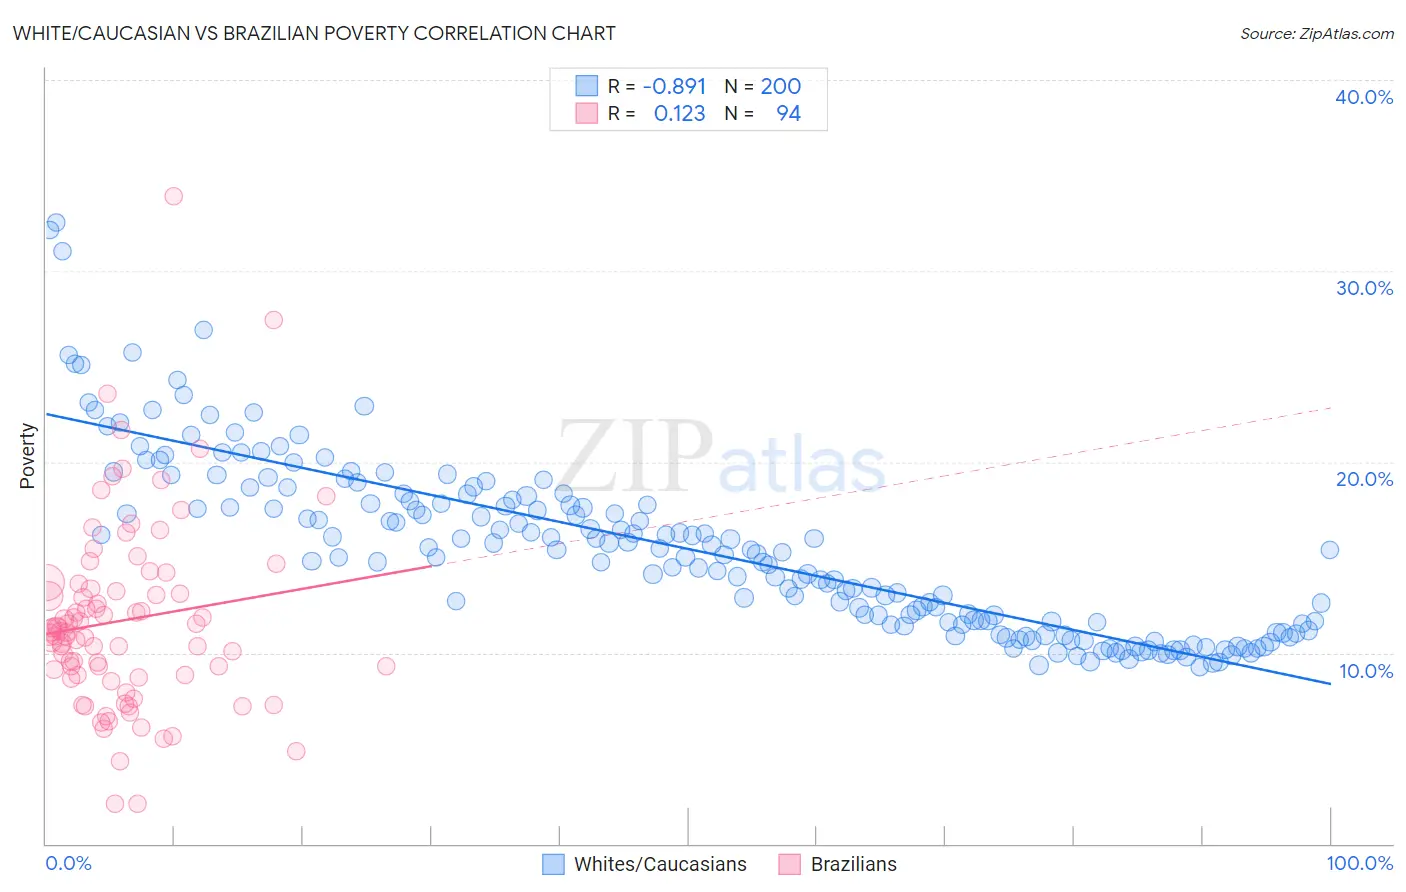
White/Caucasian vs Brazilian Poverty Correlation Chart
The statistical analysis conducted on geographies consisting of 583,792,023 people shows a very strong negative correlation between the proportion of Whites/Caucasians and poverty level in the United States with a correlation coefficient (R) of -0.891 and weighted average of 12.3%. Similarly, the statistical analysis conducted on geographies consisting of 323,736,461 people shows a poor positive correlation between the proportion of Brazilians and poverty level in the United States with a correlation coefficient (R) of 0.123 and weighted average of 11.9%, a difference of 2.9%.
Poverty Correlation Summary
| Measurement | White/Caucasian | Brazilian |
| Minimum | 9.2% | 2.1% |
| Maximum | 32.6% | 33.9% |
| Range | 23.3% | 31.8% |
| Mean | 15.4% | 11.7% |
| Median | 15.2% | 11.1% |
| Interquartile 25% (IQ1) | 11.5% | 8.8% |
| Interquartile 75% (IQ3) | 18.0% | 13.3% |
| Interquartile Range (IQR) | 6.5% | 4.5% |
| Standard Deviation (Sample) | 4.6% | 5.0% |
| Standard Deviation (Population) | 4.6% | 5.0% |
Similar Demographics by Poverty
Demographics Similar to Whites/Caucasians by Poverty
In terms of poverty, the demographic groups most similar to Whites/Caucasians are Immigrants from Oceania (12.3%, a difference of 0.080%), Immigrants from Venezuela (12.2%, a difference of 0.11%), Immigrants from Chile (12.2%, a difference of 0.13%), Venezuelan (12.2%, a difference of 0.15%), and Immigrants from Albania (12.2%, a difference of 0.23%).
| Demographics | Rating | Rank | Poverty |
| Ethiopians | 59.1 /100 | #162 | Average 12.2% |
| Immigrants | Ethiopia | 58.6 /100 | #163 | Average 12.2% |
| Colombians | 57.8 /100 | #164 | Average 12.2% |
| Immigrants | Albania | 57.7 /100 | #165 | Average 12.2% |
| Venezuelans | 56.9 /100 | #166 | Average 12.2% |
| Immigrants | Chile | 56.7 /100 | #167 | Average 12.2% |
| Immigrants | Venezuela | 56.5 /100 | #168 | Average 12.2% |
| Whites/Caucasians | 55.4 /100 | #169 | Average 12.3% |
| Immigrants | Oceania | 54.6 /100 | #170 | Average 12.3% |
| Immigrants | Spain | 51.3 /100 | #171 | Average 12.3% |
| Immigrants | Portugal | 50.5 /100 | #172 | Average 12.3% |
| Celtics | 50.1 /100 | #173 | Average 12.3% |
| Lebanese | 50.0 /100 | #174 | Average 12.3% |
| South Americans | 48.7 /100 | #175 | Average 12.3% |
| Immigrants | Colombia | 47.7 /100 | #176 | Average 12.3% |
Demographics Similar to Brazilians by Poverty
In terms of poverty, the demographic groups most similar to Brazilians are Basque (11.9%, a difference of 0.11%), Immigrants from France (11.9%, a difference of 0.12%), Immigrants from Peru (11.9%, a difference of 0.22%), Icelander (11.9%, a difference of 0.27%), and Pakistani (11.9%, a difference of 0.41%).
| Demographics | Rating | Rank | Poverty |
| Chileans | 84.2 /100 | #136 | Excellent 11.8% |
| Immigrants | Switzerland | 83.0 /100 | #137 | Excellent 11.8% |
| Immigrants | Jordan | 82.4 /100 | #138 | Excellent 11.9% |
| Pakistanis | 82.2 /100 | #139 | Excellent 11.9% |
| Immigrants | Peru | 81.1 /100 | #140 | Excellent 11.9% |
| Immigrants | France | 80.5 /100 | #141 | Excellent 11.9% |
| Basques | 80.4 /100 | #142 | Excellent 11.9% |
| Brazilians | 79.7 /100 | #143 | Good 11.9% |
| Icelanders | 77.9 /100 | #144 | Good 11.9% |
| Syrians | 75.1 /100 | #145 | Good 12.0% |
| Afghans | 74.9 /100 | #146 | Good 12.0% |
| Immigrants | Bosnia and Herzegovina | 73.7 /100 | #147 | Good 12.0% |
| Immigrants | Germany | 72.7 /100 | #148 | Good 12.0% |
| Immigrants | Malaysia | 72.7 /100 | #149 | Good 12.0% |
| Immigrants | Kazakhstan | 72.3 /100 | #150 | Good 12.0% |