White/Caucasian vs Thai Self-Care Disability
COMPARE
White/Caucasian
Thai
Self-Care Disability
Self-Care Disability Comparison
Whites/Caucasians
Thais
2.6%
SELF-CARE DISABILITY
4.4/ 100
METRIC RATING
216th/ 347
METRIC RANK
2.1%
SELF-CARE DISABILITY
100.0/ 100
METRIC RATING
3rd/ 347
METRIC RANK
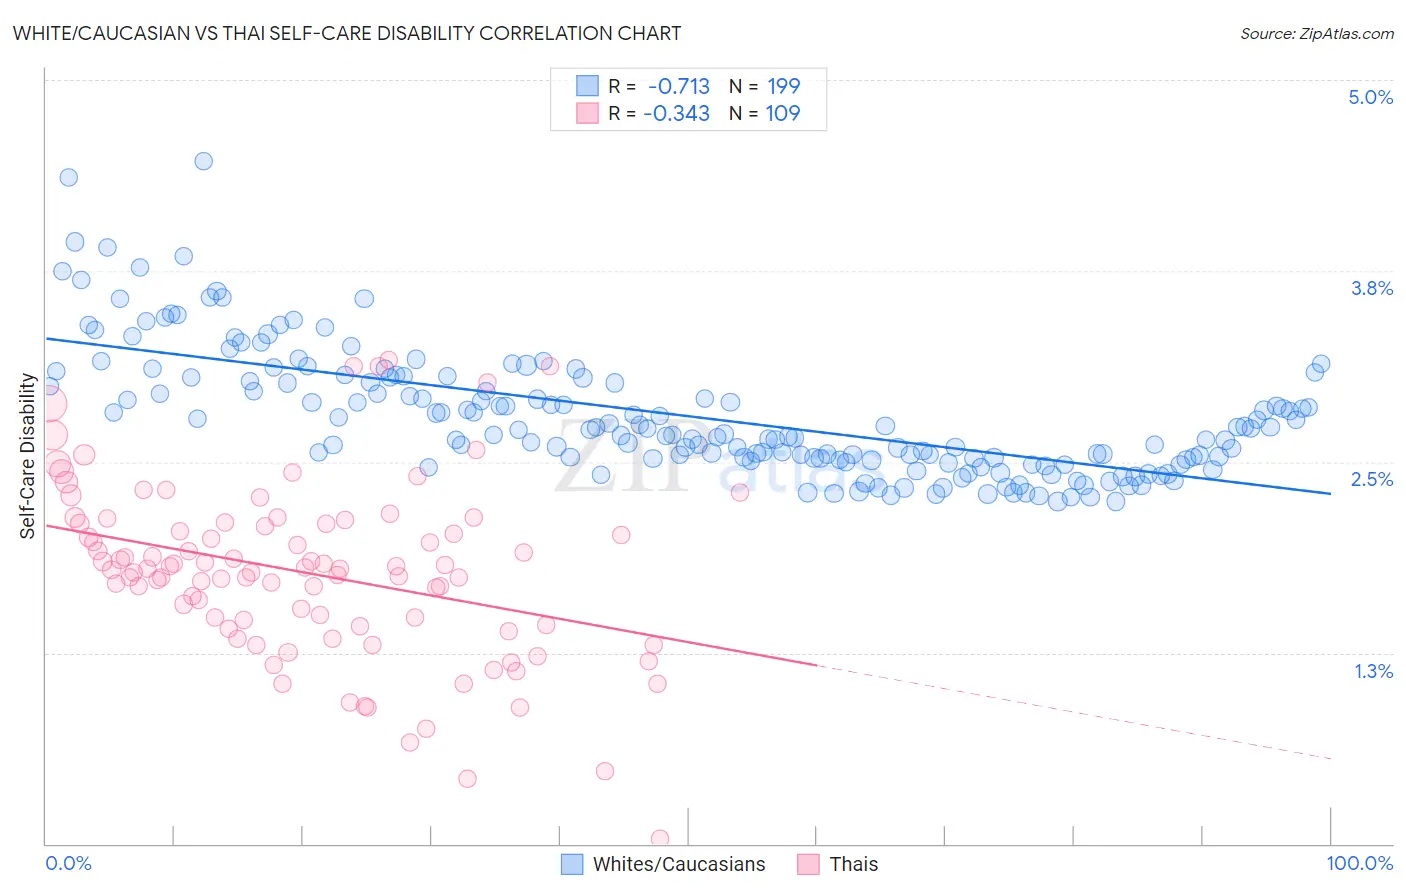
White/Caucasian vs Thai Self-Care Disability Correlation Chart
The statistical analysis conducted on geographies consisting of 580,250,955 people shows a strong negative correlation between the proportion of Whites/Caucasians and percentage of population with self-care disability in the United States with a correlation coefficient (R) of -0.713 and weighted average of 2.6%. Similarly, the statistical analysis conducted on geographies consisting of 474,998,821 people shows a mild negative correlation between the proportion of Thais and percentage of population with self-care disability in the United States with a correlation coefficient (R) of -0.343 and weighted average of 2.1%, a difference of 22.9%.
Self-Care Disability Correlation Summary
| Measurement | White/Caucasian | Thai |
| Minimum | 2.2% | 0.030% |
| Maximum | 4.5% | 3.2% |
| Range | 2.2% | 3.1% |
| Mean | 2.8% | 1.8% |
| Median | 2.7% | 1.8% |
| Interquartile 25% (IQ1) | 2.5% | 1.4% |
| Interquartile 75% (IQ3) | 3.0% | 2.1% |
| Interquartile Range (IQR) | 0.53% | 0.67% |
| Standard Deviation (Sample) | 0.41% | 0.57% |
| Standard Deviation (Population) | 0.41% | 0.57% |
Similar Demographics by Self-Care Disability
Demographics Similar to Whites/Caucasians by Self-Care Disability
In terms of self-care disability, the demographic groups most similar to Whites/Caucasians are Immigrants from Thailand (2.6%, a difference of 0.020%), Celtic (2.6%, a difference of 0.020%), Ecuadorian (2.6%, a difference of 0.070%), Immigrants from Honduras (2.6%, a difference of 0.070%), and Scotch-Irish (2.6%, a difference of 0.090%).
| Demographics | Rating | Rank | Self-Care Disability |
| Malaysians | 7.7 /100 | #209 | Tragic 2.5% |
| Panamanians | 6.4 /100 | #210 | Tragic 2.5% |
| Native Hawaiians | 5.1 /100 | #211 | Tragic 2.6% |
| Samoans | 5.1 /100 | #212 | Tragic 2.6% |
| Ecuadorians | 4.7 /100 | #213 | Tragic 2.6% |
| Immigrants | Honduras | 4.7 /100 | #214 | Tragic 2.6% |
| Immigrants | Thailand | 4.5 /100 | #215 | Tragic 2.6% |
| Whites/Caucasians | 4.4 /100 | #216 | Tragic 2.6% |
| Celtics | 4.4 /100 | #217 | Tragic 2.6% |
| Scotch-Irish | 4.1 /100 | #218 | Tragic 2.6% |
| Immigrants | Moldova | 4.0 /100 | #219 | Tragic 2.6% |
| Sub-Saharan Africans | 4.0 /100 | #220 | Tragic 2.6% |
| Hondurans | 3.8 /100 | #221 | Tragic 2.6% |
| Spaniards | 3.8 /100 | #222 | Tragic 2.6% |
| French Canadians | 3.8 /100 | #223 | Tragic 2.6% |
Demographics Similar to Thais by Self-Care Disability
In terms of self-care disability, the demographic groups most similar to Thais are Immigrants from Singapore (2.1%, a difference of 2.3%), Immigrants from India (2.0%, a difference of 3.0%), Zimbabwean (2.2%, a difference of 3.3%), Filipino (2.2%, a difference of 3.6%), and Immigrants from Bolivia (2.2%, a difference of 3.8%).
| Demographics | Rating | Rank | Self-Care Disability |
| Yup'ik | 100.0 /100 | #1 | Exceptional 1.9% |
| Immigrants | India | 100.0 /100 | #2 | Exceptional 2.0% |
| Thais | 100.0 /100 | #3 | Exceptional 2.1% |
| Immigrants | Singapore | 100.0 /100 | #4 | Exceptional 2.1% |
| Zimbabweans | 100.0 /100 | #5 | Exceptional 2.2% |
| Filipinos | 100.0 /100 | #6 | Exceptional 2.2% |
| Immigrants | Bolivia | 100.0 /100 | #7 | Exceptional 2.2% |
| Bolivians | 100.0 /100 | #8 | Exceptional 2.2% |
| Immigrants | Nepal | 100.0 /100 | #9 | Exceptional 2.2% |
| Sudanese | 100.0 /100 | #10 | Exceptional 2.2% |
| Immigrants | South Central Asia | 100.0 /100 | #11 | Exceptional 2.2% |
| Immigrants | Ethiopia | 100.0 /100 | #12 | Exceptional 2.2% |
| Ethiopians | 100.0 /100 | #13 | Exceptional 2.2% |
| Luxembourgers | 100.0 /100 | #14 | Exceptional 2.2% |
| Okinawans | 100.0 /100 | #15 | Exceptional 2.2% |