White/Caucasian vs Turkish Self-Care Disability
COMPARE
White/Caucasian
Turkish
Self-Care Disability
Self-Care Disability Comparison
Whites/Caucasians
Turks
2.6%
SELF-CARE DISABILITY
4.4/ 100
METRIC RATING
216th/ 347
METRIC RANK
2.2%
SELF-CARE DISABILITY
100.0/ 100
METRIC RATING
25th/ 347
METRIC RANK
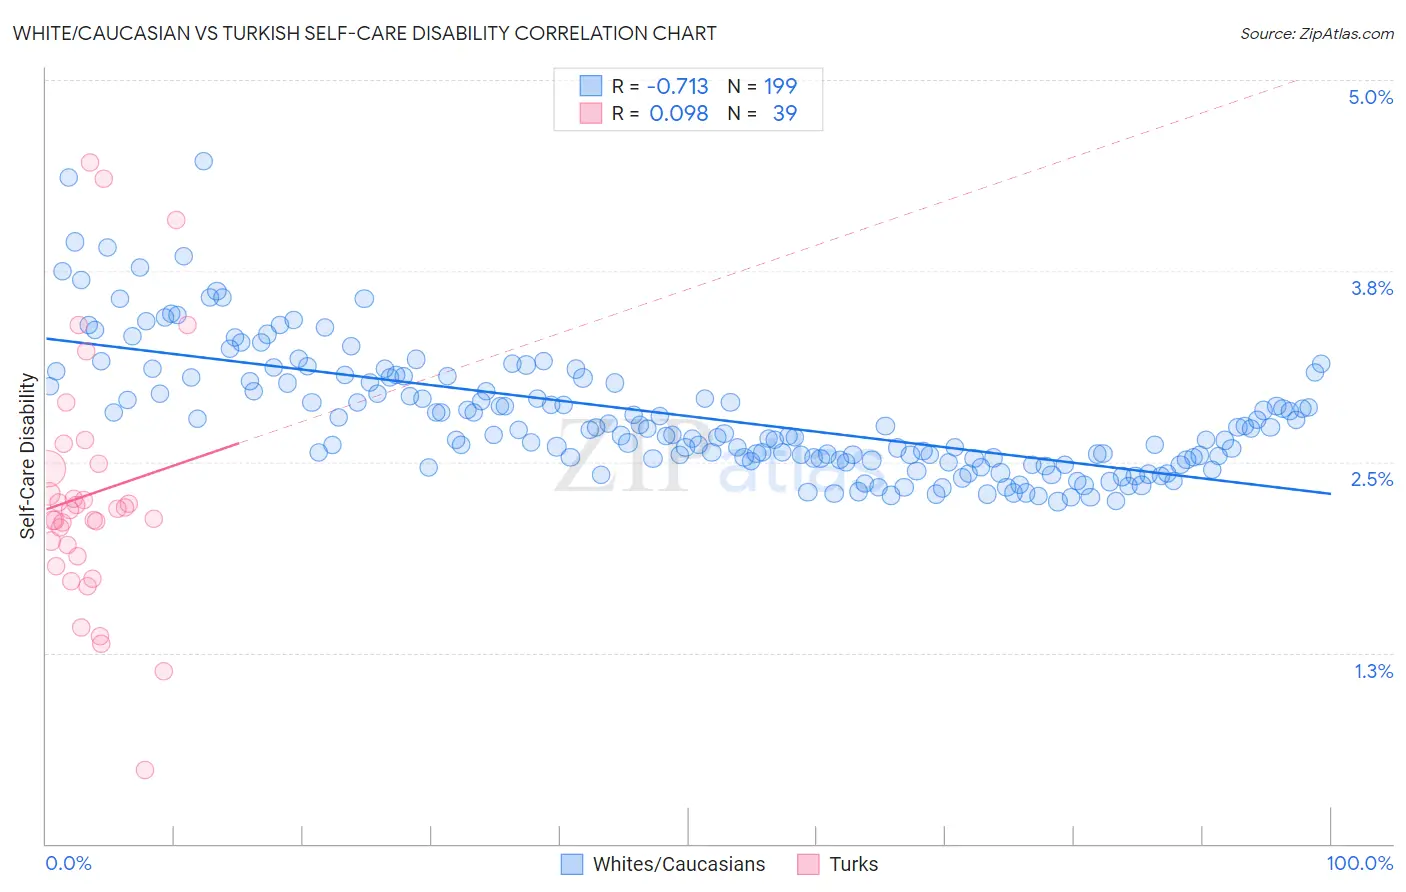
White/Caucasian vs Turkish Self-Care Disability Correlation Chart
The statistical analysis conducted on geographies consisting of 580,250,955 people shows a strong negative correlation between the proportion of Whites/Caucasians and percentage of population with self-care disability in the United States with a correlation coefficient (R) of -0.713 and weighted average of 2.6%. Similarly, the statistical analysis conducted on geographies consisting of 271,627,212 people shows a slight positive correlation between the proportion of Turks and percentage of population with self-care disability in the United States with a correlation coefficient (R) of 0.098 and weighted average of 2.2%, a difference of 14.0%.
Self-Care Disability Correlation Summary
| Measurement | White/Caucasian | Turkish |
| Minimum | 2.2% | 0.49% |
| Maximum | 4.5% | 4.5% |
| Range | 2.2% | 4.0% |
| Mean | 2.8% | 2.3% |
| Median | 2.7% | 2.2% |
| Interquartile 25% (IQ1) | 2.5% | 1.9% |
| Interquartile 75% (IQ3) | 3.0% | 2.5% |
| Interquartile Range (IQR) | 0.53% | 0.61% |
| Standard Deviation (Sample) | 0.41% | 0.81% |
| Standard Deviation (Population) | 0.41% | 0.80% |
Similar Demographics by Self-Care Disability
Demographics Similar to Whites/Caucasians by Self-Care Disability
In terms of self-care disability, the demographic groups most similar to Whites/Caucasians are Immigrants from Thailand (2.6%, a difference of 0.020%), Celtic (2.6%, a difference of 0.020%), Ecuadorian (2.6%, a difference of 0.070%), Immigrants from Honduras (2.6%, a difference of 0.070%), and Scotch-Irish (2.6%, a difference of 0.090%).
| Demographics | Rating | Rank | Self-Care Disability |
| Malaysians | 7.7 /100 | #209 | Tragic 2.5% |
| Panamanians | 6.4 /100 | #210 | Tragic 2.5% |
| Native Hawaiians | 5.1 /100 | #211 | Tragic 2.6% |
| Samoans | 5.1 /100 | #212 | Tragic 2.6% |
| Ecuadorians | 4.7 /100 | #213 | Tragic 2.6% |
| Immigrants | Honduras | 4.7 /100 | #214 | Tragic 2.6% |
| Immigrants | Thailand | 4.5 /100 | #215 | Tragic 2.6% |
| Whites/Caucasians | 4.4 /100 | #216 | Tragic 2.6% |
| Celtics | 4.4 /100 | #217 | Tragic 2.6% |
| Scotch-Irish | 4.1 /100 | #218 | Tragic 2.6% |
| Immigrants | Moldova | 4.0 /100 | #219 | Tragic 2.6% |
| Sub-Saharan Africans | 4.0 /100 | #220 | Tragic 2.6% |
| Hondurans | 3.8 /100 | #221 | Tragic 2.6% |
| Spaniards | 3.8 /100 | #222 | Tragic 2.6% |
| French Canadians | 3.8 /100 | #223 | Tragic 2.6% |
Demographics Similar to Turks by Self-Care Disability
In terms of self-care disability, the demographic groups most similar to Turks are Immigrants from Sri Lanka (2.2%, a difference of 0.070%), Venezuelan (2.2%, a difference of 0.080%), Cypriot (2.2%, a difference of 0.11%), Inupiat (2.2%, a difference of 0.24%), and Immigrants from Zimbabwe (2.3%, a difference of 0.33%).
| Demographics | Rating | Rank | Self-Care Disability |
| Immigrants | Taiwan | 100.0 /100 | #18 | Exceptional 2.2% |
| Immigrants | Eritrea | 100.0 /100 | #19 | Exceptional 2.2% |
| Tongans | 100.0 /100 | #20 | Exceptional 2.2% |
| Bulgarians | 100.0 /100 | #21 | Exceptional 2.2% |
| Immigrants | Venezuela | 100.0 /100 | #22 | Exceptional 2.2% |
| Cambodians | 100.0 /100 | #23 | Exceptional 2.2% |
| Cypriots | 100.0 /100 | #24 | Exceptional 2.2% |
| Turks | 100.0 /100 | #25 | Exceptional 2.2% |
| Immigrants | Sri Lanka | 99.9 /100 | #26 | Exceptional 2.2% |
| Venezuelans | 99.9 /100 | #27 | Exceptional 2.2% |
| Inupiat | 99.9 /100 | #28 | Exceptional 2.2% |
| Immigrants | Zimbabwe | 99.9 /100 | #29 | Exceptional 2.3% |
| Paraguayans | 99.9 /100 | #30 | Exceptional 2.3% |
| Danes | 99.9 /100 | #31 | Exceptional 2.3% |
| Burmese | 99.9 /100 | #32 | Exceptional 2.3% |