Immigrants from West Indies vs Immigrants from Burma/Myanmar Male Disability
COMPARE
Immigrants from West Indies
Immigrants from Burma/Myanmar
Male Disability
Male Disability Comparison
Immigrants from West Indies
Immigrants from Burma/Myanmar
11.1%
MALE DISABILITY
65.7/ 100
METRIC RATING
161st/ 347
METRIC RANK
11.2%
MALE DISABILITY
50.4/ 100
METRIC RATING
173rd/ 347
METRIC RANK
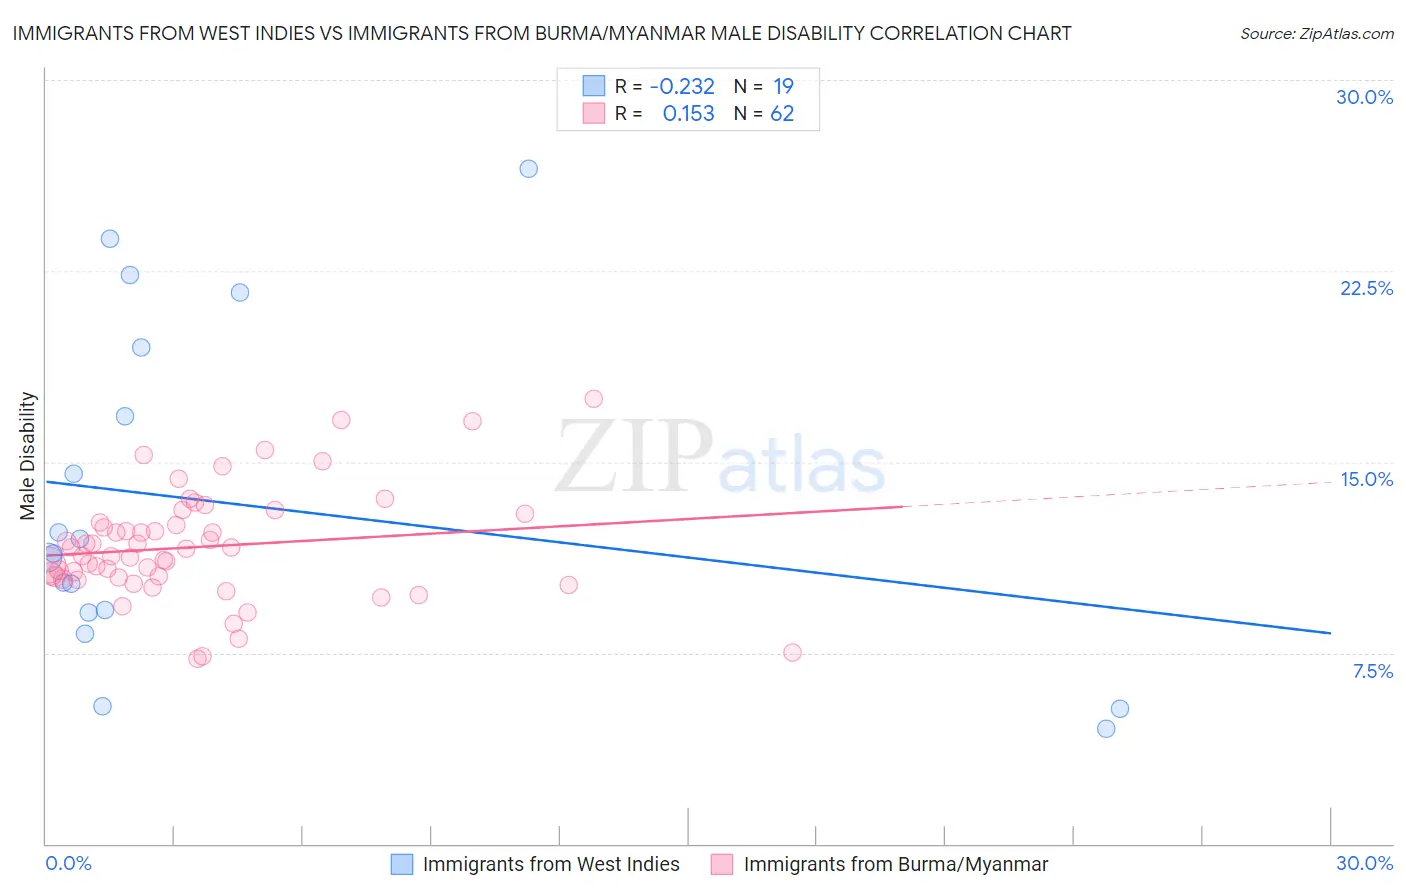
Immigrants from West Indies vs Immigrants from Burma/Myanmar Male Disability Correlation Chart
The statistical analysis conducted on geographies consisting of 72,456,461 people shows a weak negative correlation between the proportion of Immigrants from West Indies and percentage of males with a disability in the United States with a correlation coefficient (R) of -0.232 and weighted average of 11.1%. Similarly, the statistical analysis conducted on geographies consisting of 172,332,425 people shows a poor positive correlation between the proportion of Immigrants from Burma/Myanmar and percentage of males with a disability in the United States with a correlation coefficient (R) of 0.153 and weighted average of 11.2%, a difference of 0.88%.
Male Disability Correlation Summary
| Measurement | Immigrants from West Indies | Immigrants from Burma/Myanmar |
| Minimum | 4.5% | 7.3% |
| Maximum | 26.5% | 17.5% |
| Range | 22.0% | 10.2% |
| Mean | 13.4% | 11.7% |
| Median | 11.4% | 11.4% |
| Interquartile 25% (IQ1) | 9.1% | 10.5% |
| Interquartile 75% (IQ3) | 19.5% | 12.6% |
| Interquartile Range (IQR) | 10.4% | 2.1% |
| Standard Deviation (Sample) | 6.6% | 2.2% |
| Standard Deviation (Population) | 6.4% | 2.1% |
Demographics Similar to Immigrants from West Indies and Immigrants from Burma/Myanmar by Male Disability
In terms of male disability, the demographic groups most similar to Immigrants from West Indies are Immigrants from Haiti (11.1%, a difference of 0.020%), Albanian (11.1%, a difference of 0.050%), Guatemalan (11.1%, a difference of 0.090%), Immigrants from Kenya (11.1%, a difference of 0.12%), and Latvian (11.1%, a difference of 0.16%). Similarly, the demographic groups most similar to Immigrants from Burma/Myanmar are Romanian (11.2%, a difference of 0.020%), Maltese (11.2%, a difference of 0.020%), Immigrants from Honduras (11.2%, a difference of 0.10%), Haitian (11.2%, a difference of 0.12%), and New Zealander (11.2%, a difference of 0.14%).
| Demographics | Rating | Rank | Male Disability |
| Immigrants | Western Africa | 69.2 /100 | #157 | Good 11.1% |
| Latvians | 68.1 /100 | #158 | Good 11.1% |
| Guatemalans | 67.2 /100 | #159 | Good 11.1% |
| Albanians | 66.5 /100 | #160 | Good 11.1% |
| Immigrants | West Indies | 65.7 /100 | #161 | Good 11.1% |
| Immigrants | Haiti | 65.3 /100 | #162 | Good 11.1% |
| Immigrants | Kenya | 63.8 /100 | #163 | Good 11.1% |
| British West Indians | 62.8 /100 | #164 | Good 11.1% |
| Luxembourgers | 61.9 /100 | #165 | Good 11.1% |
| Immigrants | Hungary | 61.2 /100 | #166 | Good 11.1% |
| Immigrants | Southern Europe | 54.4 /100 | #167 | Average 11.2% |
| Immigrants | Latin America | 54.0 /100 | #168 | Average 11.2% |
| Barbadians | 53.4 /100 | #169 | Average 11.2% |
| New Zealanders | 52.9 /100 | #170 | Average 11.2% |
| Haitians | 52.5 /100 | #171 | Average 11.2% |
| Romanians | 50.7 /100 | #172 | Average 11.2% |
| Immigrants | Burma/Myanmar | 50.4 /100 | #173 | Average 11.2% |
| Maltese | 50.0 /100 | #174 | Average 11.2% |
| Immigrants | Honduras | 48.7 /100 | #175 | Average 11.2% |
| Syrians | 46.6 /100 | #176 | Average 11.2% |
| Immigrants | Norway | 44.2 /100 | #177 | Average 11.3% |