Tlingit-Haida vs Immigrants from Belarus Male Disability
COMPARE
Tlingit-Haida
Immigrants from Belarus
Male Disability
Male Disability Comparison
Tlingit-Haida
Immigrants from Belarus
13.8%
MALE DISABILITY
0.0/ 100
METRIC RATING
320th/ 347
METRIC RANK
10.4%
MALE DISABILITY
99.3/ 100
METRIC RATING
63rd/ 347
METRIC RANK
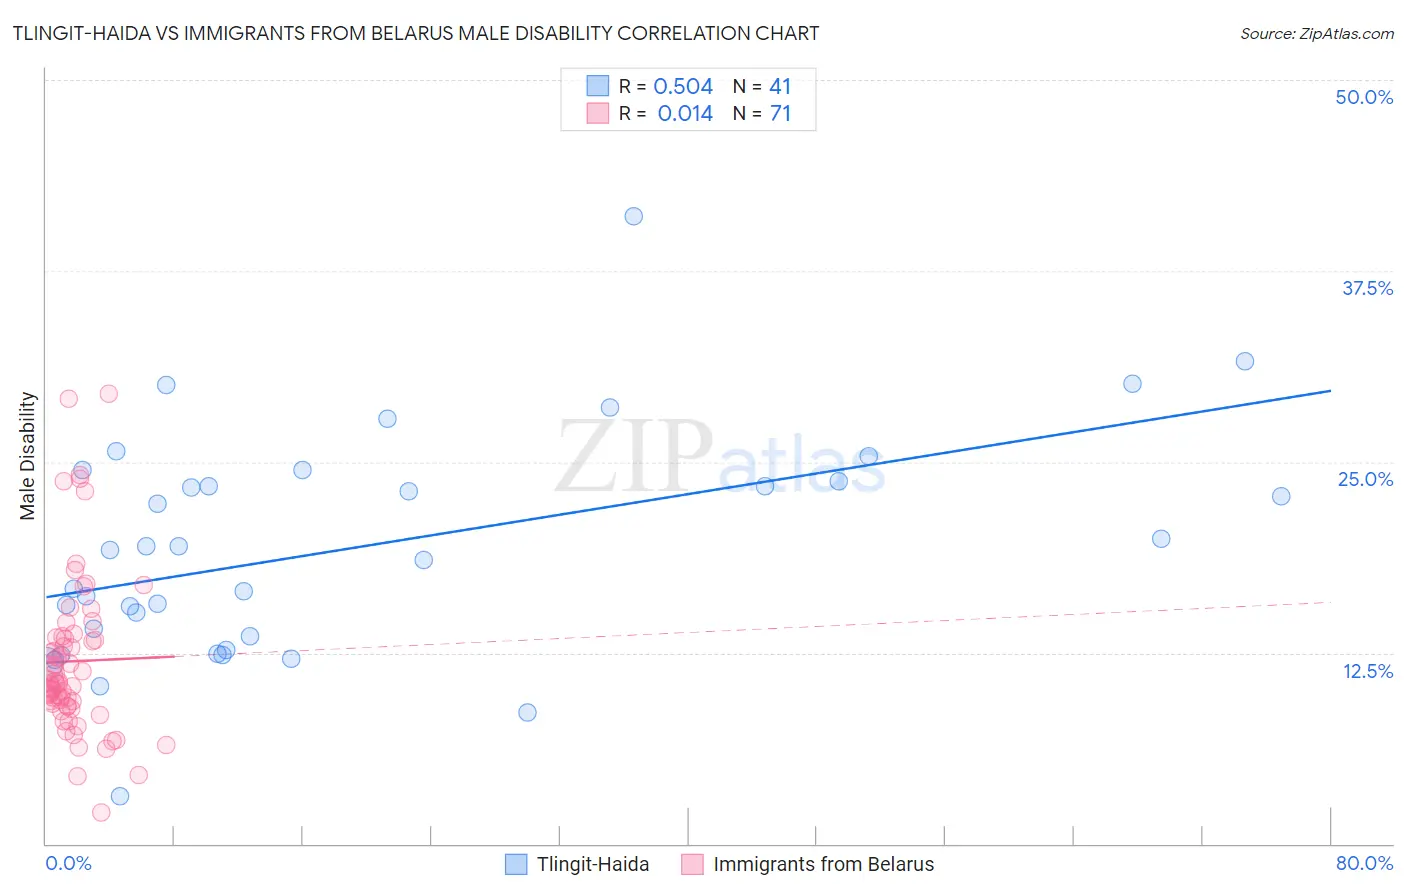
Tlingit-Haida vs Immigrants from Belarus Male Disability Correlation Chart
The statistical analysis conducted on geographies consisting of 60,851,832 people shows a substantial positive correlation between the proportion of Tlingit-Haida and percentage of males with a disability in the United States with a correlation coefficient (R) of 0.504 and weighted average of 13.8%. Similarly, the statistical analysis conducted on geographies consisting of 150,193,333 people shows no correlation between the proportion of Immigrants from Belarus and percentage of males with a disability in the United States with a correlation coefficient (R) of 0.014 and weighted average of 10.4%, a difference of 32.5%.
Male Disability Correlation Summary
| Measurement | Tlingit-Haida | Immigrants from Belarus |
| Minimum | 3.1% | 2.0% |
| Maximum | 41.1% | 29.5% |
| Range | 38.0% | 27.4% |
| Mean | 19.4% | 11.9% |
| Median | 19.2% | 10.5% |
| Interquartile 25% (IQ1) | 13.1% | 9.0% |
| Interquartile 75% (IQ3) | 24.1% | 13.5% |
| Interquartile Range (IQR) | 11.0% | 4.4% |
| Standard Deviation (Sample) | 7.4% | 5.3% |
| Standard Deviation (Population) | 7.3% | 5.2% |
Similar Demographics by Male Disability
Demographics Similar to Tlingit-Haida by Male Disability
In terms of male disability, the demographic groups most similar to Tlingit-Haida are Shoshone (13.8%, a difference of 0.050%), American (13.8%, a difference of 0.49%), Cree (13.7%, a difference of 0.90%), Paiute (13.7%, a difference of 1.1%), and Apache (14.0%, a difference of 1.2%).
| Demographics | Rating | Rank | Male Disability |
| Puget Sound Salish | 0.0 /100 | #313 | Tragic 13.5% |
| Aleuts | 0.0 /100 | #314 | Tragic 13.5% |
| Iroquois | 0.0 /100 | #315 | Tragic 13.6% |
| Alaska Natives | 0.0 /100 | #316 | Tragic 13.6% |
| Paiute | 0.0 /100 | #317 | Tragic 13.7% |
| Cree | 0.0 /100 | #318 | Tragic 13.7% |
| Americans | 0.0 /100 | #319 | Tragic 13.8% |
| Tlingit-Haida | 0.0 /100 | #320 | Tragic 13.8% |
| Shoshone | 0.0 /100 | #321 | Tragic 13.8% |
| Apache | 0.0 /100 | #322 | Tragic 14.0% |
| Osage | 0.0 /100 | #323 | Tragic 14.0% |
| Comanche | 0.0 /100 | #324 | Tragic 14.1% |
| Ottawa | 0.0 /100 | #325 | Tragic 14.1% |
| Natives/Alaskans | 0.0 /100 | #326 | Tragic 14.2% |
| Potawatomi | 0.0 /100 | #327 | Tragic 14.2% |
Demographics Similar to Immigrants from Belarus by Male Disability
In terms of male disability, the demographic groups most similar to Immigrants from Belarus are Immigrants from Ecuador (10.4%, a difference of 0.020%), Jordanian (10.5%, a difference of 0.12%), Immigrants from Grenada (10.5%, a difference of 0.15%), Guyanese (10.5%, a difference of 0.15%), and Immigrants from Afghanistan (10.5%, a difference of 0.16%).
| Demographics | Rating | Rank | Male Disability |
| Tongans | 99.6 /100 | #56 | Exceptional 10.4% |
| Immigrants | South America | 99.6 /100 | #57 | Exceptional 10.4% |
| Immigrants | Japan | 99.5 /100 | #58 | Exceptional 10.4% |
| Immigrants | Australia | 99.5 /100 | #59 | Exceptional 10.4% |
| Immigrants | Colombia | 99.5 /100 | #60 | Exceptional 10.4% |
| Immigrants | Northern Africa | 99.4 /100 | #61 | Exceptional 10.4% |
| Immigrants | Ecuador | 99.3 /100 | #62 | Exceptional 10.4% |
| Immigrants | Belarus | 99.3 /100 | #63 | Exceptional 10.4% |
| Jordanians | 99.3 /100 | #64 | Exceptional 10.5% |
| Immigrants | Grenada | 99.2 /100 | #65 | Exceptional 10.5% |
| Guyanese | 99.2 /100 | #66 | Exceptional 10.5% |
| Immigrants | Afghanistan | 99.2 /100 | #67 | Exceptional 10.5% |
| Colombians | 99.2 /100 | #68 | Exceptional 10.5% |
| Ecuadorians | 99.2 /100 | #69 | Exceptional 10.5% |
| Immigrants | Bulgaria | 99.1 /100 | #70 | Exceptional 10.5% |