Tlingit-Haida vs Liberian Male Disability
COMPARE
Tlingit-Haida
Liberian
Male Disability
Male Disability Comparison
Tlingit-Haida
Liberians
13.8%
MALE DISABILITY
0.0/ 100
METRIC RATING
320th/ 347
METRIC RANK
11.8%
MALE DISABILITY
3.1/ 100
METRIC RATING
225th/ 347
METRIC RANK
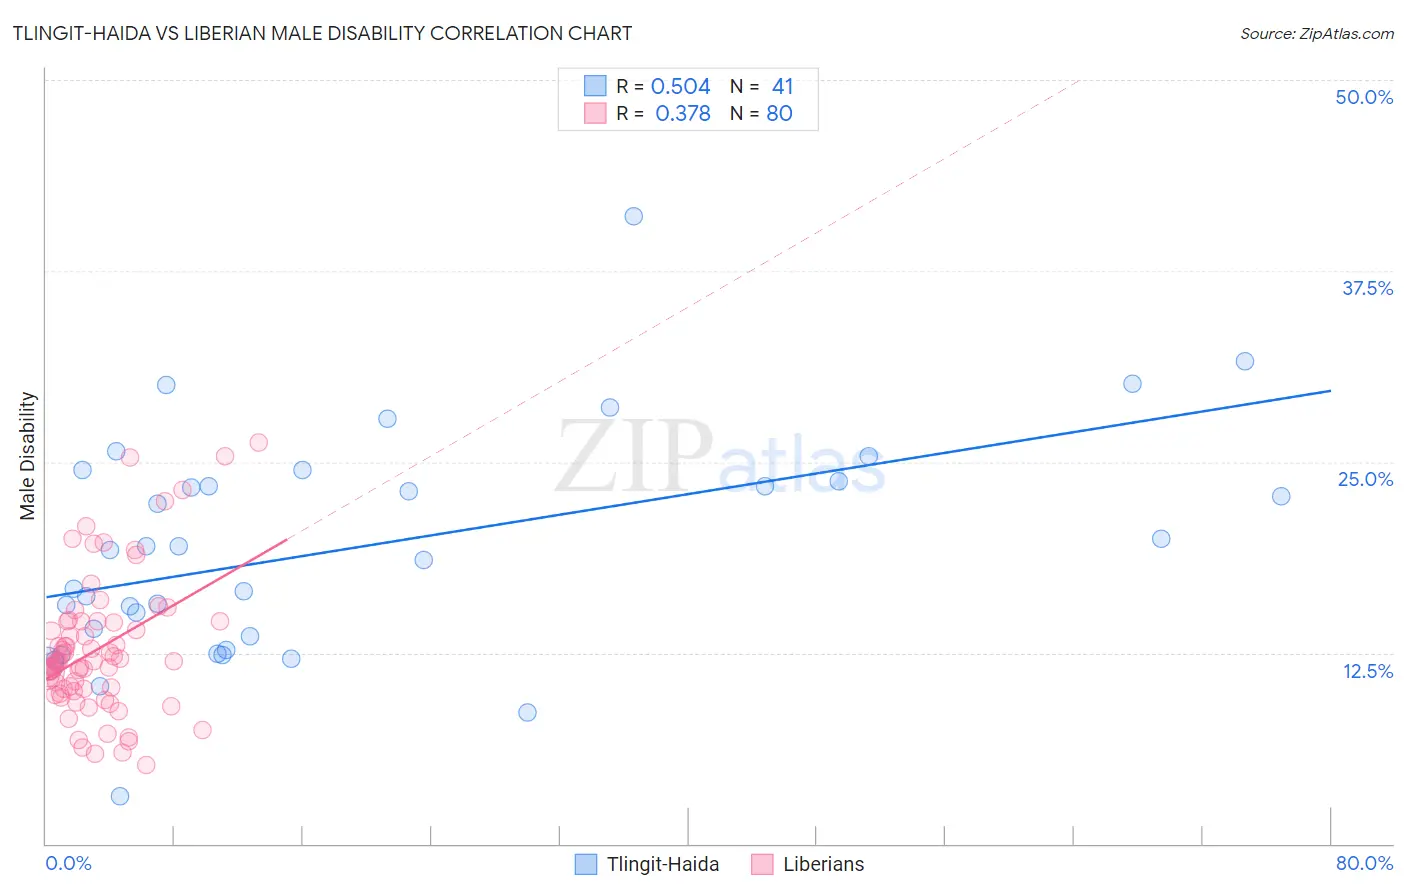
Tlingit-Haida vs Liberian Male Disability Correlation Chart
The statistical analysis conducted on geographies consisting of 60,851,832 people shows a substantial positive correlation between the proportion of Tlingit-Haida and percentage of males with a disability in the United States with a correlation coefficient (R) of 0.504 and weighted average of 13.8%. Similarly, the statistical analysis conducted on geographies consisting of 118,082,647 people shows a mild positive correlation between the proportion of Liberians and percentage of males with a disability in the United States with a correlation coefficient (R) of 0.378 and weighted average of 11.8%, a difference of 17.7%.
Male Disability Correlation Summary
| Measurement | Tlingit-Haida | Liberian |
| Minimum | 3.1% | 5.2% |
| Maximum | 41.1% | 26.3% |
| Range | 38.0% | 21.1% |
| Mean | 19.4% | 12.8% |
| Median | 19.2% | 11.9% |
| Interquartile 25% (IQ1) | 13.1% | 10.1% |
| Interquartile 75% (IQ3) | 24.1% | 14.5% |
| Interquartile Range (IQR) | 11.0% | 4.5% |
| Standard Deviation (Sample) | 7.4% | 4.5% |
| Standard Deviation (Population) | 7.3% | 4.5% |
Similar Demographics by Male Disability
Demographics Similar to Tlingit-Haida by Male Disability
In terms of male disability, the demographic groups most similar to Tlingit-Haida are Shoshone (13.8%, a difference of 0.050%), American (13.8%, a difference of 0.49%), Cree (13.7%, a difference of 0.90%), Paiute (13.7%, a difference of 1.1%), and Apache (14.0%, a difference of 1.2%).
| Demographics | Rating | Rank | Male Disability |
| Puget Sound Salish | 0.0 /100 | #313 | Tragic 13.5% |
| Aleuts | 0.0 /100 | #314 | Tragic 13.5% |
| Iroquois | 0.0 /100 | #315 | Tragic 13.6% |
| Alaska Natives | 0.0 /100 | #316 | Tragic 13.6% |
| Paiute | 0.0 /100 | #317 | Tragic 13.7% |
| Cree | 0.0 /100 | #318 | Tragic 13.7% |
| Americans | 0.0 /100 | #319 | Tragic 13.8% |
| Tlingit-Haida | 0.0 /100 | #320 | Tragic 13.8% |
| Shoshone | 0.0 /100 | #321 | Tragic 13.8% |
| Apache | 0.0 /100 | #322 | Tragic 14.0% |
| Osage | 0.0 /100 | #323 | Tragic 14.0% |
| Comanche | 0.0 /100 | #324 | Tragic 14.1% |
| Ottawa | 0.0 /100 | #325 | Tragic 14.1% |
| Natives/Alaskans | 0.0 /100 | #326 | Tragic 14.2% |
| Potawatomi | 0.0 /100 | #327 | Tragic 14.2% |
Demographics Similar to Liberians by Male Disability
In terms of male disability, the demographic groups most similar to Liberians are Japanese (11.7%, a difference of 0.010%), Immigrants from Bahamas (11.7%, a difference of 0.030%), Alsatian (11.7%, a difference of 0.12%), Subsaharan African (11.8%, a difference of 0.12%), and Immigrants from Congo (11.7%, a difference of 0.27%).
| Demographics | Rating | Rank | Male Disability |
| Immigrants | England | 4.0 /100 | #218 | Tragic 11.7% |
| Panamanians | 3.8 /100 | #219 | Tragic 11.7% |
| Immigrants | Western Europe | 3.8 /100 | #220 | Tragic 11.7% |
| Immigrants | Congo | 3.7 /100 | #221 | Tragic 11.7% |
| Alsatians | 3.3 /100 | #222 | Tragic 11.7% |
| Immigrants | Bahamas | 3.2 /100 | #223 | Tragic 11.7% |
| Japanese | 3.1 /100 | #224 | Tragic 11.7% |
| Liberians | 3.1 /100 | #225 | Tragic 11.8% |
| Sub-Saharan Africans | 2.8 /100 | #226 | Tragic 11.8% |
| Austrians | 2.5 /100 | #227 | Tragic 11.8% |
| Hispanics or Latinos | 2.3 /100 | #228 | Tragic 11.8% |
| Bermudans | 2.3 /100 | #229 | Tragic 11.8% |
| Croatians | 2.1 /100 | #230 | Tragic 11.8% |
| Dominicans | 1.8 /100 | #231 | Tragic 11.8% |
| Malaysians | 1.8 /100 | #232 | Tragic 11.8% |