Tlingit-Haida vs Immigrants from Eastern Africa Male Disability
COMPARE
Tlingit-Haida
Immigrants from Eastern Africa
Male Disability
Male Disability Comparison
Tlingit-Haida
Immigrants from Eastern Africa
13.8%
MALE DISABILITY
0.0/ 100
METRIC RATING
320th/ 347
METRIC RANK
10.8%
MALE DISABILITY
94.3/ 100
METRIC RATING
107th/ 347
METRIC RANK
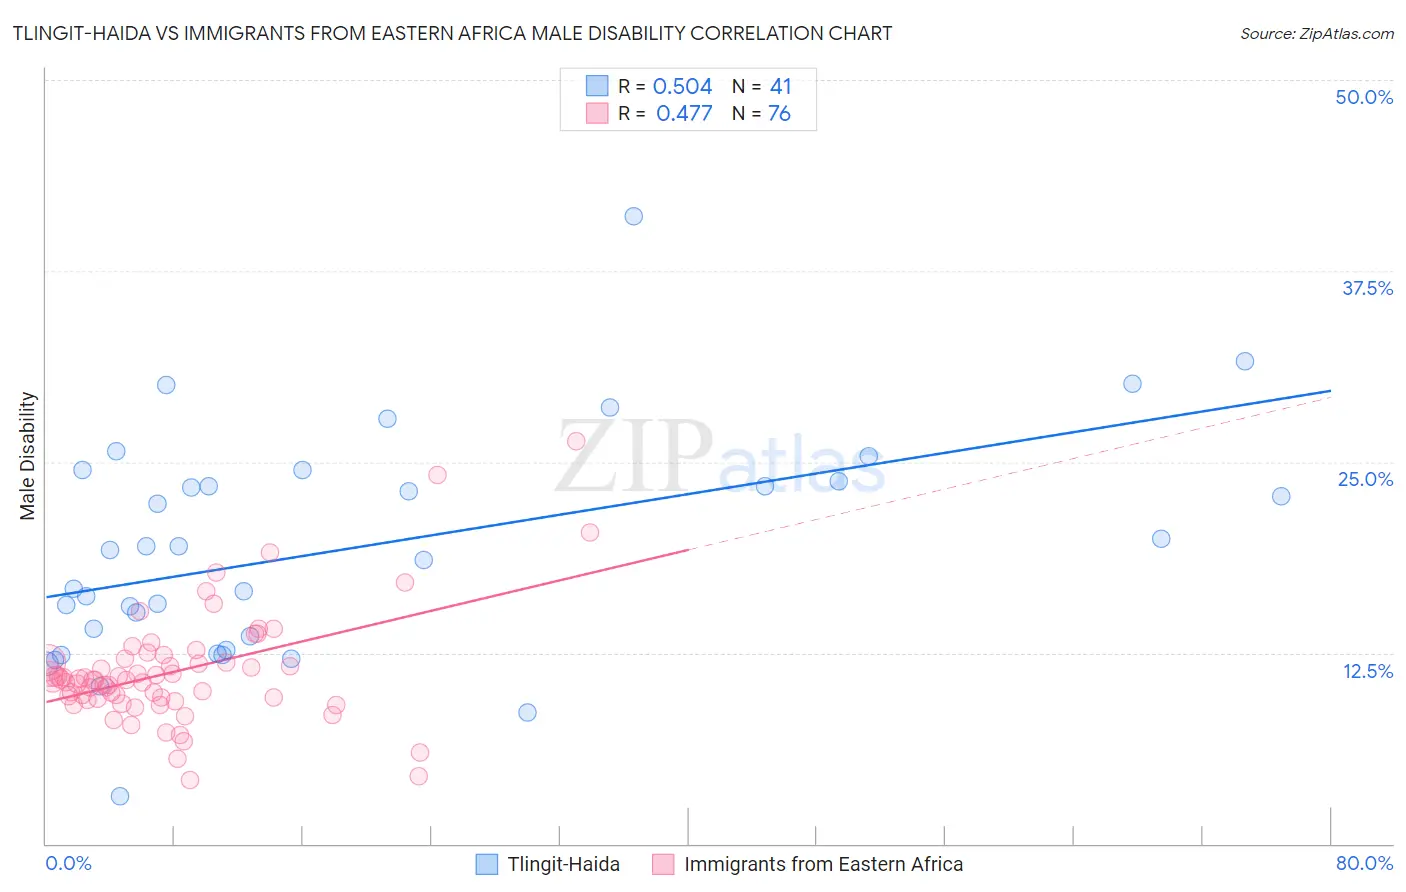
Tlingit-Haida vs Immigrants from Eastern Africa Male Disability Correlation Chart
The statistical analysis conducted on geographies consisting of 60,851,832 people shows a substantial positive correlation between the proportion of Tlingit-Haida and percentage of males with a disability in the United States with a correlation coefficient (R) of 0.504 and weighted average of 13.8%. Similarly, the statistical analysis conducted on geographies consisting of 355,104,040 people shows a moderate positive correlation between the proportion of Immigrants from Eastern Africa and percentage of males with a disability in the United States with a correlation coefficient (R) of 0.477 and weighted average of 10.8%, a difference of 28.3%.
Male Disability Correlation Summary
| Measurement | Tlingit-Haida | Immigrants from Eastern Africa |
| Minimum | 3.1% | 4.2% |
| Maximum | 41.1% | 26.3% |
| Range | 38.0% | 22.2% |
| Mean | 19.4% | 11.3% |
| Median | 19.2% | 10.8% |
| Interquartile 25% (IQ1) | 13.1% | 9.5% |
| Interquartile 75% (IQ3) | 24.1% | 12.0% |
| Interquartile Range (IQR) | 11.0% | 2.5% |
| Standard Deviation (Sample) | 7.4% | 3.7% |
| Standard Deviation (Population) | 7.3% | 3.7% |
Similar Demographics by Male Disability
Demographics Similar to Tlingit-Haida by Male Disability
In terms of male disability, the demographic groups most similar to Tlingit-Haida are Shoshone (13.8%, a difference of 0.050%), American (13.8%, a difference of 0.49%), Cree (13.7%, a difference of 0.90%), Paiute (13.7%, a difference of 1.1%), and Apache (14.0%, a difference of 1.2%).
| Demographics | Rating | Rank | Male Disability |
| Puget Sound Salish | 0.0 /100 | #313 | Tragic 13.5% |
| Aleuts | 0.0 /100 | #314 | Tragic 13.5% |
| Iroquois | 0.0 /100 | #315 | Tragic 13.6% |
| Alaska Natives | 0.0 /100 | #316 | Tragic 13.6% |
| Paiute | 0.0 /100 | #317 | Tragic 13.7% |
| Cree | 0.0 /100 | #318 | Tragic 13.7% |
| Americans | 0.0 /100 | #319 | Tragic 13.8% |
| Tlingit-Haida | 0.0 /100 | #320 | Tragic 13.8% |
| Shoshone | 0.0 /100 | #321 | Tragic 13.8% |
| Apache | 0.0 /100 | #322 | Tragic 14.0% |
| Osage | 0.0 /100 | #323 | Tragic 14.0% |
| Comanche | 0.0 /100 | #324 | Tragic 14.1% |
| Ottawa | 0.0 /100 | #325 | Tragic 14.1% |
| Natives/Alaskans | 0.0 /100 | #326 | Tragic 14.2% |
| Potawatomi | 0.0 /100 | #327 | Tragic 14.2% |
Demographics Similar to Immigrants from Eastern Africa by Male Disability
In terms of male disability, the demographic groups most similar to Immigrants from Eastern Africa are Immigrants from Belgium (10.8%, a difference of 0.020%), Immigrants from Uganda (10.8%, a difference of 0.070%), Immigrants (10.8%, a difference of 0.090%), Immigrants from Uruguay (10.8%, a difference of 0.13%), and Immigrants from Syria (10.8%, a difference of 0.18%).
| Demographics | Rating | Rank | Male Disability |
| Immigrants | Kazakhstan | 95.9 /100 | #100 | Exceptional 10.7% |
| Immigrants | Greece | 95.6 /100 | #101 | Exceptional 10.7% |
| Immigrants | Eastern Europe | 95.3 /100 | #102 | Exceptional 10.7% |
| Uruguayans | 95.3 /100 | #103 | Exceptional 10.7% |
| Immigrants | Nigeria | 95.1 /100 | #104 | Exceptional 10.8% |
| Immigrants | Brazil | 95.0 /100 | #105 | Exceptional 10.8% |
| Immigrants | Syria | 94.9 /100 | #106 | Exceptional 10.8% |
| Immigrants | Eastern Africa | 94.3 /100 | #107 | Exceptional 10.8% |
| Immigrants | Belgium | 94.2 /100 | #108 | Exceptional 10.8% |
| Immigrants | Uganda | 94.0 /100 | #109 | Exceptional 10.8% |
| Immigrants | Immigrants | 93.9 /100 | #110 | Exceptional 10.8% |
| Immigrants | Uruguay | 93.8 /100 | #111 | Exceptional 10.8% |
| Ghanaians | 93.4 /100 | #112 | Exceptional 10.8% |
| Immigrants | Zimbabwe | 93.0 /100 | #113 | Exceptional 10.8% |
| Central Americans | 92.7 /100 | #114 | Exceptional 10.8% |