Immigrants from Pakistan vs Immigrants from Burma/Myanmar Male Disability
COMPARE
Immigrants from Pakistan
Immigrants from Burma/Myanmar
Male Disability
Male Disability Comparison
Immigrants from Pakistan
Immigrants from Burma/Myanmar
9.8%
MALE DISABILITY
100.0/ 100
METRIC RATING
18th/ 347
METRIC RANK
11.2%
MALE DISABILITY
50.4/ 100
METRIC RATING
173rd/ 347
METRIC RANK
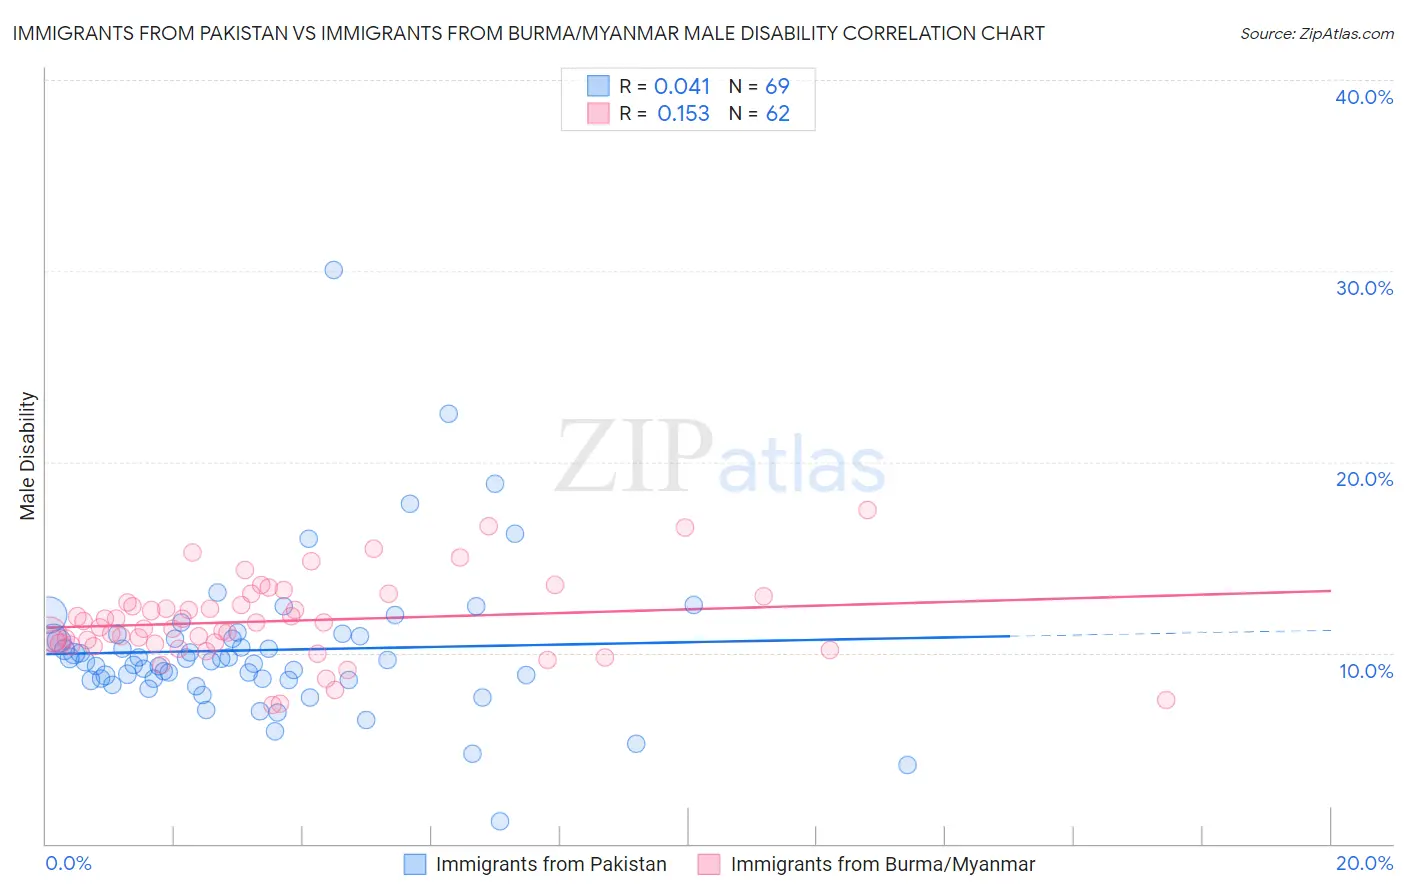
Immigrants from Pakistan vs Immigrants from Burma/Myanmar Male Disability Correlation Chart
The statistical analysis conducted on geographies consisting of 283,893,374 people shows no correlation between the proportion of Immigrants from Pakistan and percentage of males with a disability in the United States with a correlation coefficient (R) of 0.041 and weighted average of 9.8%. Similarly, the statistical analysis conducted on geographies consisting of 172,332,425 people shows a poor positive correlation between the proportion of Immigrants from Burma/Myanmar and percentage of males with a disability in the United States with a correlation coefficient (R) of 0.153 and weighted average of 11.2%, a difference of 13.9%.
Male Disability Correlation Summary
| Measurement | Immigrants from Pakistan | Immigrants from Burma/Myanmar |
| Minimum | 1.2% | 7.3% |
| Maximum | 30.0% | 17.5% |
| Range | 28.8% | 10.2% |
| Mean | 10.1% | 11.7% |
| Median | 9.6% | 11.4% |
| Interquartile 25% (IQ1) | 8.6% | 10.5% |
| Interquartile 75% (IQ3) | 10.8% | 12.6% |
| Interquartile Range (IQR) | 2.2% | 2.1% |
| Standard Deviation (Sample) | 4.0% | 2.2% |
| Standard Deviation (Population) | 4.0% | 2.1% |
Similar Demographics by Male Disability
Demographics Similar to Immigrants from Pakistan by Male Disability
In terms of male disability, the demographic groups most similar to Immigrants from Pakistan are Immigrants from Korea (9.8%, a difference of 0.56%), Okinawan (9.8%, a difference of 0.70%), Immigrants from Sri Lanka (10.0%, a difference of 1.2%), Asian (10.0%, a difference of 1.2%), and Indian (Asian) (9.7%, a difference of 1.3%).
| Demographics | Rating | Rank | Male Disability |
| Immigrants | Eastern Asia | 100.0 /100 | #11 | Exceptional 9.6% |
| Bolivians | 100.0 /100 | #12 | Exceptional 9.6% |
| Iranians | 100.0 /100 | #13 | Exceptional 9.7% |
| Immigrants | Iran | 100.0 /100 | #14 | Exceptional 9.7% |
| Indians (Asian) | 100.0 /100 | #15 | Exceptional 9.7% |
| Okinawans | 100.0 /100 | #16 | Exceptional 9.8% |
| Immigrants | Korea | 100.0 /100 | #17 | Exceptional 9.8% |
| Immigrants | Pakistan | 100.0 /100 | #18 | Exceptional 9.8% |
| Immigrants | Sri Lanka | 100.0 /100 | #19 | Exceptional 10.0% |
| Asians | 100.0 /100 | #20 | Exceptional 10.0% |
| Burmese | 100.0 /100 | #21 | Exceptional 10.0% |
| Immigrants | Venezuela | 100.0 /100 | #22 | Exceptional 10.0% |
| Cypriots | 100.0 /100 | #23 | Exceptional 10.0% |
| Immigrants | Asia | 100.0 /100 | #24 | Exceptional 10.0% |
| Immigrants | Malaysia | 99.9 /100 | #25 | Exceptional 10.0% |
Demographics Similar to Immigrants from Burma/Myanmar by Male Disability
In terms of male disability, the demographic groups most similar to Immigrants from Burma/Myanmar are Romanian (11.2%, a difference of 0.020%), Maltese (11.2%, a difference of 0.020%), Immigrants from Honduras (11.2%, a difference of 0.10%), Haitian (11.2%, a difference of 0.12%), and New Zealander (11.2%, a difference of 0.14%).
| Demographics | Rating | Rank | Male Disability |
| Immigrants | Hungary | 61.2 /100 | #166 | Good 11.1% |
| Immigrants | Southern Europe | 54.4 /100 | #167 | Average 11.2% |
| Immigrants | Latin America | 54.0 /100 | #168 | Average 11.2% |
| Barbadians | 53.4 /100 | #169 | Average 11.2% |
| New Zealanders | 52.9 /100 | #170 | Average 11.2% |
| Haitians | 52.5 /100 | #171 | Average 11.2% |
| Romanians | 50.7 /100 | #172 | Average 11.2% |
| Immigrants | Burma/Myanmar | 50.4 /100 | #173 | Average 11.2% |
| Maltese | 50.0 /100 | #174 | Average 11.2% |
| Immigrants | Honduras | 48.7 /100 | #175 | Average 11.2% |
| Syrians | 46.6 /100 | #176 | Average 11.2% |
| Immigrants | Norway | 44.2 /100 | #177 | Average 11.3% |
| Australians | 42.2 /100 | #178 | Average 11.3% |
| Immigrants | Caribbean | 41.4 /100 | #179 | Average 11.3% |
| Hondurans | 41.1 /100 | #180 | Average 11.3% |