Tlingit-Haida vs Immigrants from Jordan Male Disability
COMPARE
Tlingit-Haida
Immigrants from Jordan
Male Disability
Male Disability Comparison
Tlingit-Haida
Immigrants from Jordan
13.8%
MALE DISABILITY
0.0/ 100
METRIC RATING
320th/ 347
METRIC RANK
10.6%
MALE DISABILITY
98.4/ 100
METRIC RATING
80th/ 347
METRIC RANK
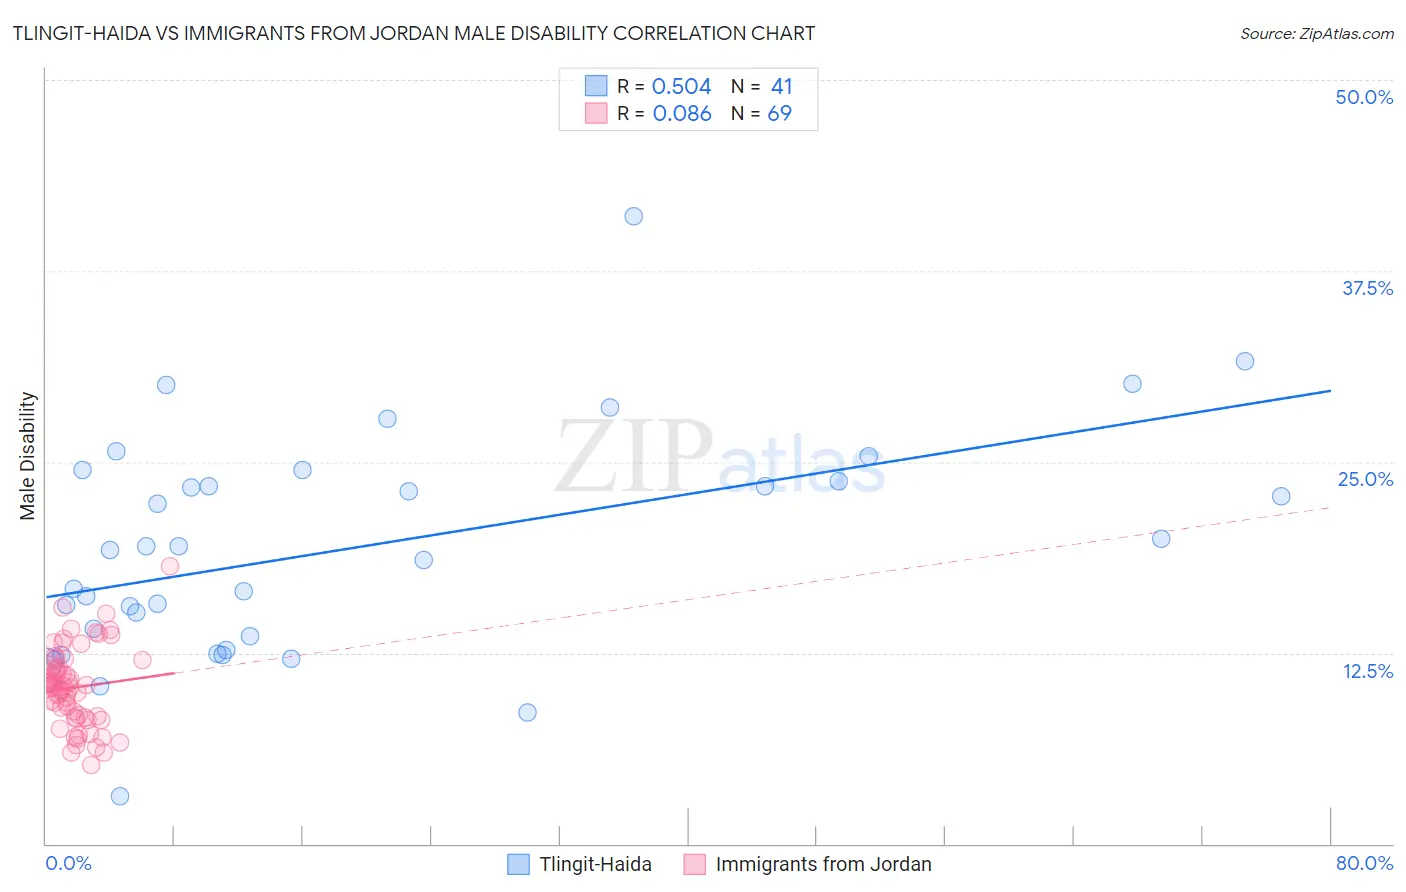
Tlingit-Haida vs Immigrants from Jordan Male Disability Correlation Chart
The statistical analysis conducted on geographies consisting of 60,851,832 people shows a substantial positive correlation between the proportion of Tlingit-Haida and percentage of males with a disability in the United States with a correlation coefficient (R) of 0.504 and weighted average of 13.8%. Similarly, the statistical analysis conducted on geographies consisting of 181,276,340 people shows a slight positive correlation between the proportion of Immigrants from Jordan and percentage of males with a disability in the United States with a correlation coefficient (R) of 0.086 and weighted average of 10.6%, a difference of 30.8%.
Male Disability Correlation Summary
| Measurement | Tlingit-Haida | Immigrants from Jordan |
| Minimum | 3.1% | 5.2% |
| Maximum | 41.1% | 18.2% |
| Range | 38.0% | 13.0% |
| Mean | 19.4% | 10.2% |
| Median | 19.2% | 10.2% |
| Interquartile 25% (IQ1) | 13.1% | 8.3% |
| Interquartile 75% (IQ3) | 24.1% | 11.5% |
| Interquartile Range (IQR) | 11.0% | 3.2% |
| Standard Deviation (Sample) | 7.4% | 2.5% |
| Standard Deviation (Population) | 7.3% | 2.5% |
Similar Demographics by Male Disability
Demographics Similar to Tlingit-Haida by Male Disability
In terms of male disability, the demographic groups most similar to Tlingit-Haida are Shoshone (13.8%, a difference of 0.050%), American (13.8%, a difference of 0.49%), Cree (13.7%, a difference of 0.90%), Paiute (13.7%, a difference of 1.1%), and Apache (14.0%, a difference of 1.2%).
| Demographics | Rating | Rank | Male Disability |
| Puget Sound Salish | 0.0 /100 | #313 | Tragic 13.5% |
| Aleuts | 0.0 /100 | #314 | Tragic 13.5% |
| Iroquois | 0.0 /100 | #315 | Tragic 13.6% |
| Alaska Natives | 0.0 /100 | #316 | Tragic 13.6% |
| Paiute | 0.0 /100 | #317 | Tragic 13.7% |
| Cree | 0.0 /100 | #318 | Tragic 13.7% |
| Americans | 0.0 /100 | #319 | Tragic 13.8% |
| Tlingit-Haida | 0.0 /100 | #320 | Tragic 13.8% |
| Shoshone | 0.0 /100 | #321 | Tragic 13.8% |
| Apache | 0.0 /100 | #322 | Tragic 14.0% |
| Osage | 0.0 /100 | #323 | Tragic 14.0% |
| Comanche | 0.0 /100 | #324 | Tragic 14.1% |
| Ottawa | 0.0 /100 | #325 | Tragic 14.1% |
| Natives/Alaskans | 0.0 /100 | #326 | Tragic 14.2% |
| Potawatomi | 0.0 /100 | #327 | Tragic 14.2% |
Demographics Similar to Immigrants from Jordan by Male Disability
In terms of male disability, the demographic groups most similar to Immigrants from Jordan are Zimbabwean (10.6%, a difference of 0.020%), Immigrants from Chile (10.6%, a difference of 0.060%), Immigrants from Guyana (10.6%, a difference of 0.13%), Immigrants from Poland (10.6%, a difference of 0.19%), and Bulgarian (10.6%, a difference of 0.20%).
| Demographics | Rating | Rank | Male Disability |
| Immigrants | Lithuania | 98.9 /100 | #73 | Exceptional 10.5% |
| Immigrants | Lebanon | 98.8 /100 | #74 | Exceptional 10.5% |
| Sierra Leoneans | 98.7 /100 | #75 | Exceptional 10.5% |
| Immigrants | Sierra Leone | 98.7 /100 | #76 | Exceptional 10.5% |
| Laotians | 98.6 /100 | #77 | Exceptional 10.6% |
| Immigrants | Russia | 98.6 /100 | #78 | Exceptional 10.6% |
| Zimbabweans | 98.4 /100 | #79 | Exceptional 10.6% |
| Immigrants | Jordan | 98.4 /100 | #80 | Exceptional 10.6% |
| Immigrants | Chile | 98.3 /100 | #81 | Exceptional 10.6% |
| Immigrants | Guyana | 98.2 /100 | #82 | Exceptional 10.6% |
| Immigrants | Poland | 98.1 /100 | #83 | Exceptional 10.6% |
| Bulgarians | 98.1 /100 | #84 | Exceptional 10.6% |
| Sri Lankans | 97.9 /100 | #85 | Exceptional 10.6% |
| Immigrants | Ireland | 97.9 /100 | #86 | Exceptional 10.6% |
| Immigrants | Vietnam | 97.9 /100 | #87 | Exceptional 10.6% |