Puget Sound Salish vs Immigrants from Burma/Myanmar Male Disability
COMPARE
Puget Sound Salish
Immigrants from Burma/Myanmar
Male Disability
Male Disability Comparison
Puget Sound Salish
Immigrants from Burma/Myanmar
13.5%
MALE DISABILITY
0.0/ 100
METRIC RATING
313th/ 347
METRIC RANK
11.2%
MALE DISABILITY
50.4/ 100
METRIC RATING
173rd/ 347
METRIC RANK
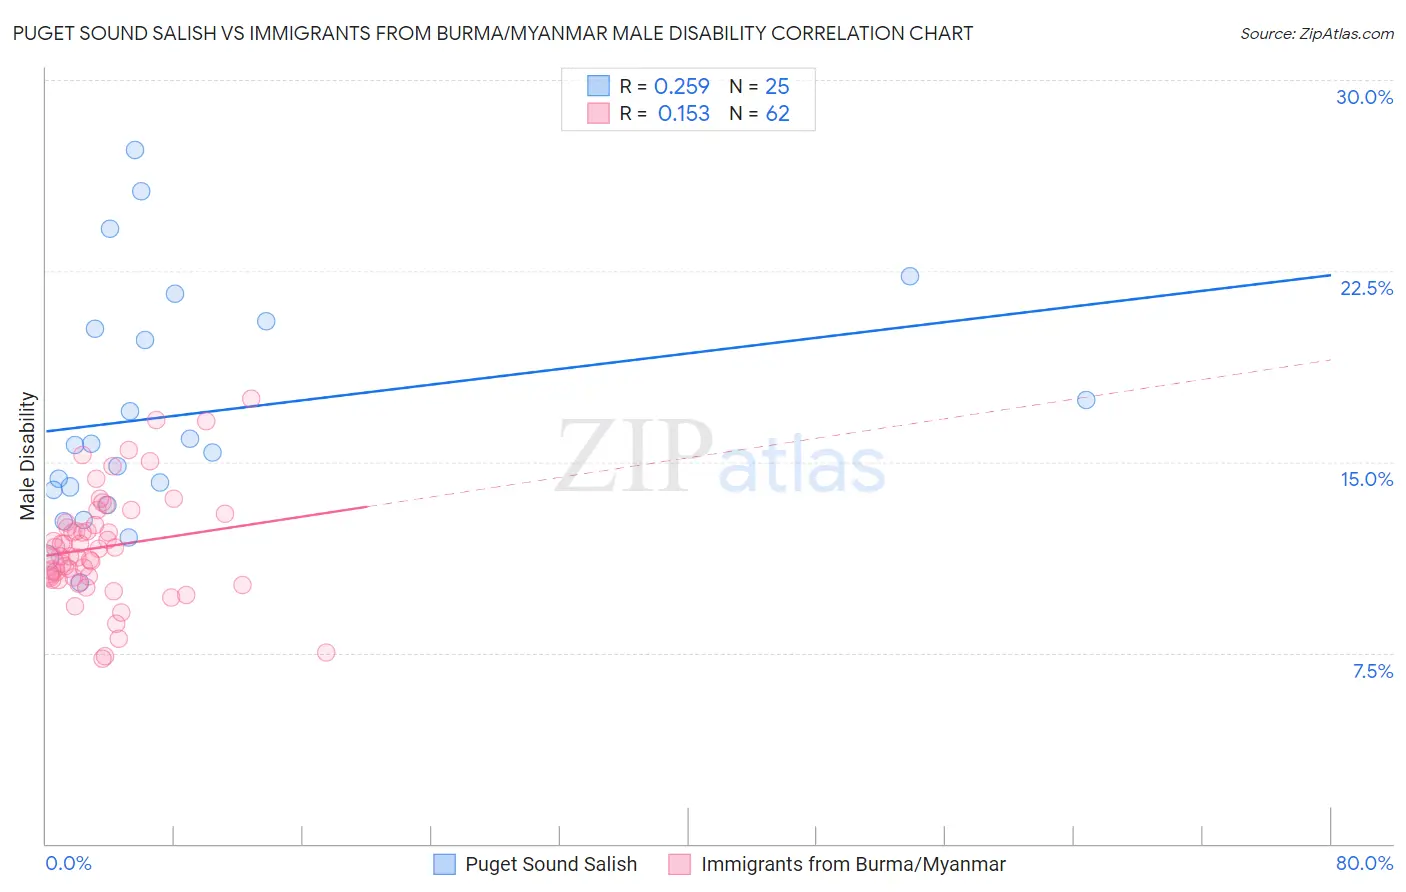
Puget Sound Salish vs Immigrants from Burma/Myanmar Male Disability Correlation Chart
The statistical analysis conducted on geographies consisting of 46,152,398 people shows a weak positive correlation between the proportion of Puget Sound Salish and percentage of males with a disability in the United States with a correlation coefficient (R) of 0.259 and weighted average of 13.5%. Similarly, the statistical analysis conducted on geographies consisting of 172,332,425 people shows a poor positive correlation between the proportion of Immigrants from Burma/Myanmar and percentage of males with a disability in the United States with a correlation coefficient (R) of 0.153 and weighted average of 11.2%, a difference of 20.7%.
Male Disability Correlation Summary
| Measurement | Puget Sound Salish | Immigrants from Burma/Myanmar |
| Minimum | 10.3% | 7.3% |
| Maximum | 27.3% | 17.5% |
| Range | 17.0% | 10.2% |
| Mean | 16.9% | 11.7% |
| Median | 15.6% | 11.4% |
| Interquartile 25% (IQ1) | 13.6% | 10.5% |
| Interquartile 75% (IQ3) | 20.4% | 12.6% |
| Interquartile Range (IQR) | 6.8% | 2.1% |
| Standard Deviation (Sample) | 4.6% | 2.2% |
| Standard Deviation (Population) | 4.5% | 2.1% |
Similar Demographics by Male Disability
Demographics Similar to Puget Sound Salish by Male Disability
In terms of male disability, the demographic groups most similar to Puget Sound Salish are Yakama (13.5%, a difference of 0.020%), Aleut (13.5%, a difference of 0.060%), Iroquois (13.6%, a difference of 0.22%), Alaska Native (13.6%, a difference of 0.27%), and Delaware (13.5%, a difference of 0.57%).
| Demographics | Rating | Rank | Male Disability |
| Spanish Americans | 0.0 /100 | #306 | Tragic 13.3% |
| Arapaho | 0.0 /100 | #307 | Tragic 13.3% |
| French American Indians | 0.0 /100 | #308 | Tragic 13.4% |
| Blackfeet | 0.0 /100 | #309 | Tragic 13.4% |
| Immigrants | Azores | 0.0 /100 | #310 | Tragic 13.4% |
| Delaware | 0.0 /100 | #311 | Tragic 13.5% |
| Yakama | 0.0 /100 | #312 | Tragic 13.5% |
| Puget Sound Salish | 0.0 /100 | #313 | Tragic 13.5% |
| Aleuts | 0.0 /100 | #314 | Tragic 13.5% |
| Iroquois | 0.0 /100 | #315 | Tragic 13.6% |
| Alaska Natives | 0.0 /100 | #316 | Tragic 13.6% |
| Paiute | 0.0 /100 | #317 | Tragic 13.7% |
| Cree | 0.0 /100 | #318 | Tragic 13.7% |
| Americans | 0.0 /100 | #319 | Tragic 13.8% |
| Tlingit-Haida | 0.0 /100 | #320 | Tragic 13.8% |
Demographics Similar to Immigrants from Burma/Myanmar by Male Disability
In terms of male disability, the demographic groups most similar to Immigrants from Burma/Myanmar are Romanian (11.2%, a difference of 0.020%), Maltese (11.2%, a difference of 0.020%), Immigrants from Honduras (11.2%, a difference of 0.10%), Haitian (11.2%, a difference of 0.12%), and New Zealander (11.2%, a difference of 0.14%).
| Demographics | Rating | Rank | Male Disability |
| Immigrants | Hungary | 61.2 /100 | #166 | Good 11.1% |
| Immigrants | Southern Europe | 54.4 /100 | #167 | Average 11.2% |
| Immigrants | Latin America | 54.0 /100 | #168 | Average 11.2% |
| Barbadians | 53.4 /100 | #169 | Average 11.2% |
| New Zealanders | 52.9 /100 | #170 | Average 11.2% |
| Haitians | 52.5 /100 | #171 | Average 11.2% |
| Romanians | 50.7 /100 | #172 | Average 11.2% |
| Immigrants | Burma/Myanmar | 50.4 /100 | #173 | Average 11.2% |
| Maltese | 50.0 /100 | #174 | Average 11.2% |
| Immigrants | Honduras | 48.7 /100 | #175 | Average 11.2% |
| Syrians | 46.6 /100 | #176 | Average 11.2% |
| Immigrants | Norway | 44.2 /100 | #177 | Average 11.3% |
| Australians | 42.2 /100 | #178 | Average 11.3% |
| Immigrants | Caribbean | 41.4 /100 | #179 | Average 11.3% |
| Hondurans | 41.1 /100 | #180 | Average 11.3% |