Tlingit-Haida vs Choctaw Disability Age 35 to 64
COMPARE
Tlingit-Haida
Choctaw
Disability Age 35 to 64
Disability Age 35 to 64 Comparison
Tlingit-Haida
Choctaw
13.2%
DISABILITY AGE 35 TO 64
0.0/ 100
METRIC RATING
287th/ 347
METRIC RANK
16.4%
DISABILITY AGE 35 TO 64
0.0/ 100
METRIC RATING
340th/ 347
METRIC RANK
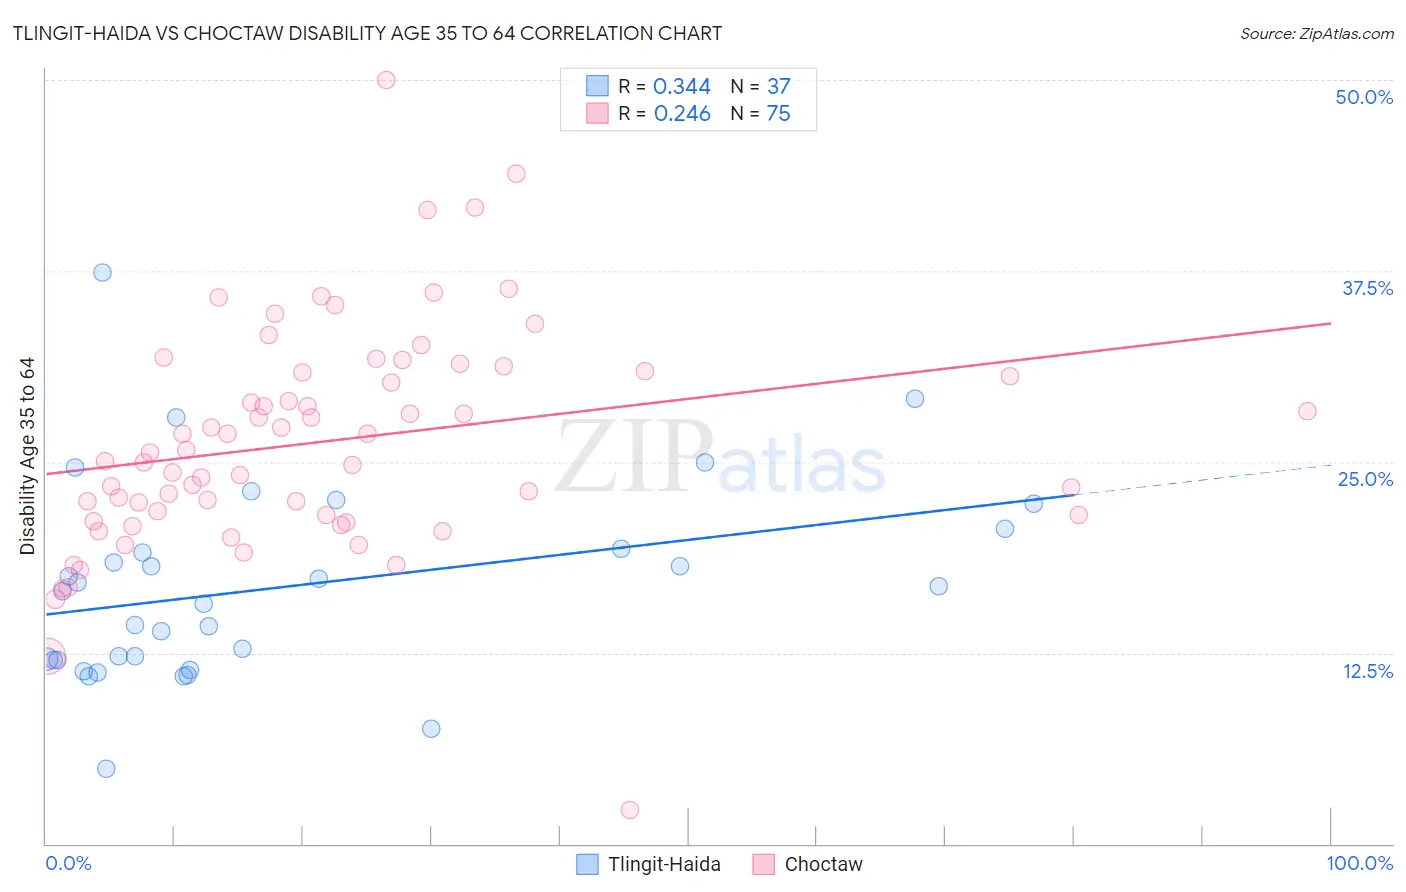
Tlingit-Haida vs Choctaw Disability Age 35 to 64 Correlation Chart
The statistical analysis conducted on geographies consisting of 60,853,720 people shows a mild positive correlation between the proportion of Tlingit-Haida and percentage of population with a disability between the ages 34 and 64 in the United States with a correlation coefficient (R) of 0.344 and weighted average of 13.2%. Similarly, the statistical analysis conducted on geographies consisting of 269,605,356 people shows a weak positive correlation between the proportion of Choctaw and percentage of population with a disability between the ages 34 and 64 in the United States with a correlation coefficient (R) of 0.246 and weighted average of 16.4%, a difference of 24.5%.
Disability Age 35 to 64 Correlation Summary
| Measurement | Tlingit-Haida | Choctaw |
| Minimum | 4.9% | 2.2% |
| Maximum | 37.4% | 50.0% |
| Range | 32.4% | 47.8% |
| Mean | 16.8% | 26.3% |
| Median | 16.5% | 25.6% |
| Interquartile 25% (IQ1) | 12.1% | 21.5% |
| Interquartile 75% (IQ3) | 20.0% | 30.9% |
| Interquartile Range (IQR) | 7.9% | 9.4% |
| Standard Deviation (Sample) | 6.5% | 7.4% |
| Standard Deviation (Population) | 6.4% | 7.4% |
Similar Demographics by Disability Age 35 to 64
Demographics Similar to Tlingit-Haida by Disability Age 35 to 64
In terms of disability age 35 to 64, the demographic groups most similar to Tlingit-Haida are Hmong (13.1%, a difference of 0.27%), Fijian (13.2%, a difference of 0.35%), Indonesian (13.2%, a difference of 0.42%), Immigrants from Liberia (13.2%, a difference of 0.50%), and Immigrants from Somalia (13.1%, a difference of 0.58%).
| Demographics | Rating | Rank | Disability Age 35 to 64 |
| Liberians | 0.1 /100 | #280 | Tragic 12.9% |
| Scotch-Irish | 0.1 /100 | #281 | Tragic 13.0% |
| Immigrants | Laos | 0.1 /100 | #282 | Tragic 13.0% |
| Central American Indians | 0.0 /100 | #283 | Tragic 13.0% |
| Immigrants | Nonimmigrants | 0.0 /100 | #284 | Tragic 13.0% |
| Immigrants | Somalia | 0.0 /100 | #285 | Tragic 13.1% |
| Hmong | 0.0 /100 | #286 | Tragic 13.1% |
| Tlingit-Haida | 0.0 /100 | #287 | Tragic 13.2% |
| Fijians | 0.0 /100 | #288 | Tragic 13.2% |
| Indonesians | 0.0 /100 | #289 | Tragic 13.2% |
| Immigrants | Liberia | 0.0 /100 | #290 | Tragic 13.2% |
| Immigrants | Congo | 0.0 /100 | #291 | Tragic 13.3% |
| Puget Sound Salish | 0.0 /100 | #292 | Tragic 13.3% |
| Ute | 0.0 /100 | #293 | Tragic 13.4% |
| Yaqui | 0.0 /100 | #294 | Tragic 13.5% |
Demographics Similar to Choctaw by Disability Age 35 to 64
In terms of disability age 35 to 64, the demographic groups most similar to Choctaw are Pima (16.1%, a difference of 1.7%), Chickasaw (16.1%, a difference of 1.9%), Tsimshian (16.7%, a difference of 1.9%), Tohono O'odham (16.7%, a difference of 2.0%), and Creek (16.9%, a difference of 2.9%).
| Demographics | Rating | Rank | Disability Age 35 to 64 |
| Yuman | 0.0 /100 | #333 | Tragic 15.8% |
| Colville | 0.0 /100 | #334 | Tragic 15.8% |
| Seminole | 0.0 /100 | #335 | Tragic 15.9% |
| Menominee | 0.0 /100 | #336 | Tragic 15.9% |
| Puerto Ricans | 0.0 /100 | #337 | Tragic 15.9% |
| Chickasaw | 0.0 /100 | #338 | Tragic 16.1% |
| Pima | 0.0 /100 | #339 | Tragic 16.1% |
| Choctaw | 0.0 /100 | #340 | Tragic 16.4% |
| Tsimshian | 0.0 /100 | #341 | Tragic 16.7% |
| Tohono O'odham | 0.0 /100 | #342 | Tragic 16.7% |
| Creek | 0.0 /100 | #343 | Tragic 16.9% |
| Yup'ik | 0.0 /100 | #344 | Tragic 16.9% |
| Kiowa | 0.0 /100 | #345 | Tragic 17.4% |
| Lumbee | 0.0 /100 | #346 | Tragic 17.6% |
| Houma | 0.0 /100 | #347 | Tragic 18.7% |