Tlingit-Haida vs Inupiat Disability Age 35 to 64
COMPARE
Tlingit-Haida
Inupiat
Disability Age 35 to 64
Disability Age 35 to 64 Comparison
Tlingit-Haida
Inupiat
13.2%
DISABILITY AGE 35 TO 64
0.0/ 100
METRIC RATING
287th/ 347
METRIC RANK
14.1%
DISABILITY AGE 35 TO 64
0.0/ 100
METRIC RATING
308th/ 347
METRIC RANK
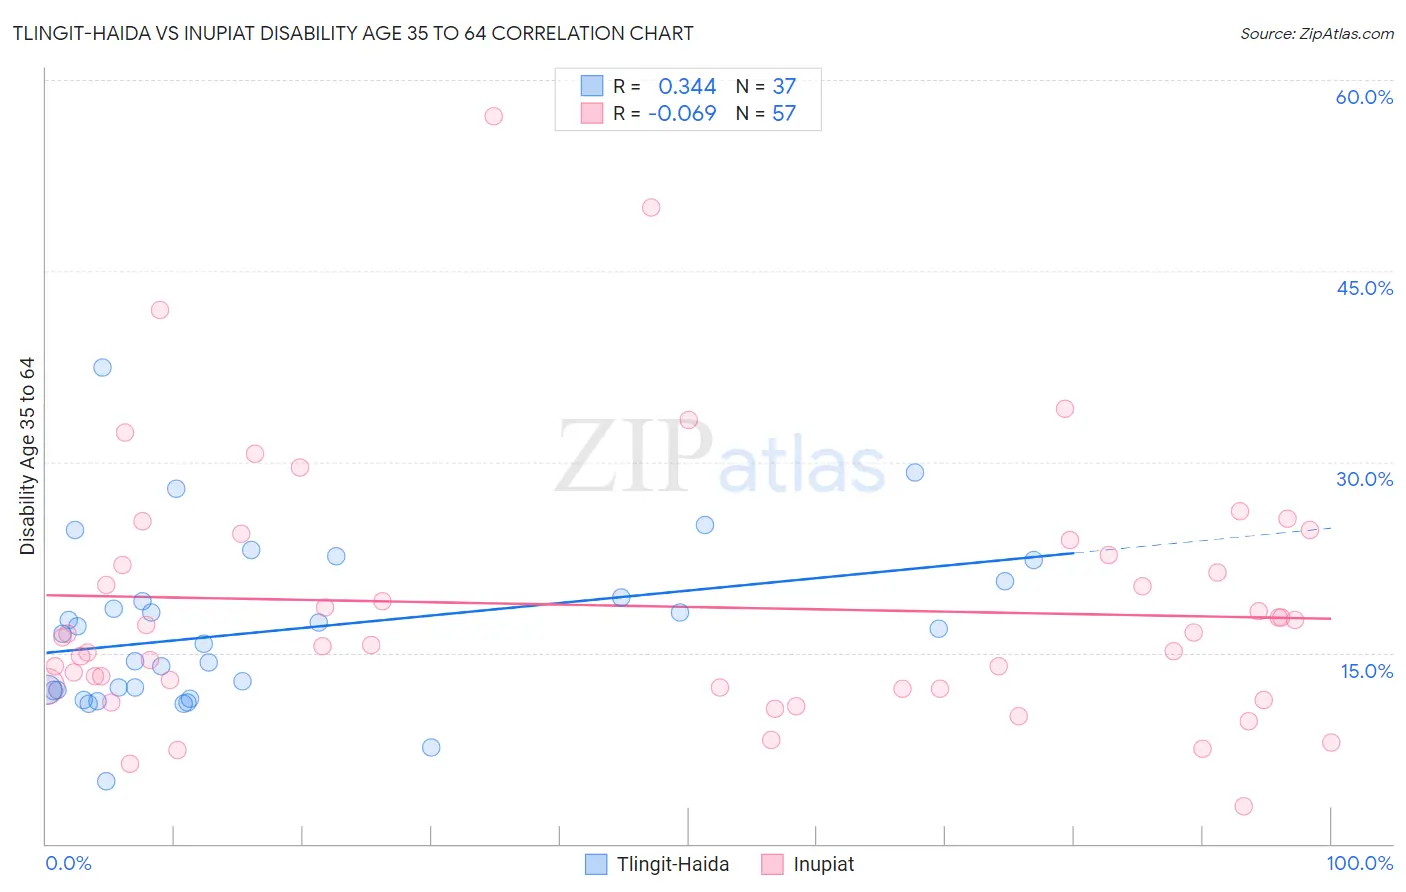
Tlingit-Haida vs Inupiat Disability Age 35 to 64 Correlation Chart
The statistical analysis conducted on geographies consisting of 60,853,720 people shows a mild positive correlation between the proportion of Tlingit-Haida and percentage of population with a disability between the ages 34 and 64 in the United States with a correlation coefficient (R) of 0.344 and weighted average of 13.2%. Similarly, the statistical analysis conducted on geographies consisting of 96,326,282 people shows a slight negative correlation between the proportion of Inupiat and percentage of population with a disability between the ages 34 and 64 in the United States with a correlation coefficient (R) of -0.069 and weighted average of 14.1%, a difference of 6.7%.
Disability Age 35 to 64 Correlation Summary
| Measurement | Tlingit-Haida | Inupiat |
| Minimum | 4.9% | 2.9% |
| Maximum | 37.4% | 57.1% |
| Range | 32.4% | 54.2% |
| Mean | 16.8% | 18.7% |
| Median | 16.5% | 16.2% |
| Interquartile 25% (IQ1) | 12.1% | 12.2% |
| Interquartile 75% (IQ3) | 20.0% | 23.3% |
| Interquartile Range (IQR) | 7.9% | 11.1% |
| Standard Deviation (Sample) | 6.5% | 10.3% |
| Standard Deviation (Population) | 6.4% | 10.2% |
Similar Demographics by Disability Age 35 to 64
Demographics Similar to Tlingit-Haida by Disability Age 35 to 64
In terms of disability age 35 to 64, the demographic groups most similar to Tlingit-Haida are Hmong (13.1%, a difference of 0.27%), Fijian (13.2%, a difference of 0.35%), Indonesian (13.2%, a difference of 0.42%), Immigrants from Liberia (13.2%, a difference of 0.50%), and Immigrants from Somalia (13.1%, a difference of 0.58%).
| Demographics | Rating | Rank | Disability Age 35 to 64 |
| Liberians | 0.1 /100 | #280 | Tragic 12.9% |
| Scotch-Irish | 0.1 /100 | #281 | Tragic 13.0% |
| Immigrants | Laos | 0.1 /100 | #282 | Tragic 13.0% |
| Central American Indians | 0.0 /100 | #283 | Tragic 13.0% |
| Immigrants | Nonimmigrants | 0.0 /100 | #284 | Tragic 13.0% |
| Immigrants | Somalia | 0.0 /100 | #285 | Tragic 13.1% |
| Hmong | 0.0 /100 | #286 | Tragic 13.1% |
| Tlingit-Haida | 0.0 /100 | #287 | Tragic 13.2% |
| Fijians | 0.0 /100 | #288 | Tragic 13.2% |
| Indonesians | 0.0 /100 | #289 | Tragic 13.2% |
| Immigrants | Liberia | 0.0 /100 | #290 | Tragic 13.2% |
| Immigrants | Congo | 0.0 /100 | #291 | Tragic 13.3% |
| Puget Sound Salish | 0.0 /100 | #292 | Tragic 13.3% |
| Ute | 0.0 /100 | #293 | Tragic 13.4% |
| Yaqui | 0.0 /100 | #294 | Tragic 13.5% |
Demographics Similar to Inupiat by Disability Age 35 to 64
In terms of disability age 35 to 64, the demographic groups most similar to Inupiat are Blackfeet (14.1%, a difference of 0.030%), Cree (14.1%, a difference of 0.070%), Immigrants from Yemen (14.0%, a difference of 0.19%), Cape Verdean (14.1%, a difference of 0.54%), and American (13.9%, a difference of 1.1%).
| Demographics | Rating | Rank | Disability Age 35 to 64 |
| French American Indians | 0.0 /100 | #301 | Tragic 13.7% |
| Aleuts | 0.0 /100 | #302 | Tragic 13.8% |
| Sioux | 0.0 /100 | #303 | Tragic 13.9% |
| Hopi | 0.0 /100 | #304 | Tragic 13.9% |
| Americans | 0.0 /100 | #305 | Tragic 13.9% |
| Immigrants | Yemen | 0.0 /100 | #306 | Tragic 14.0% |
| Blackfeet | 0.0 /100 | #307 | Tragic 14.1% |
| Inupiat | 0.0 /100 | #308 | Tragic 14.1% |
| Cree | 0.0 /100 | #309 | Tragic 14.1% |
| Cape Verdeans | 0.0 /100 | #310 | Tragic 14.1% |
| Immigrants | Azores | 0.0 /100 | #311 | Tragic 14.3% |
| Paiute | 0.0 /100 | #312 | Tragic 14.3% |
| Iroquois | 0.0 /100 | #313 | Tragic 14.4% |
| Shoshone | 0.0 /100 | #314 | Tragic 14.5% |
| Alaska Natives | 0.0 /100 | #315 | Tragic 14.5% |