Tlingit-Haida vs Vietnamese Disability Age 35 to 64

COMPARE

Tlingit-Haida
Race
Ancestry
AfghanAfricanAlaska NativeAlaskan AthabascanAlbanianAleutAlsatianAmericanApacheArabArapahoArgentineanArmenianAssyrian/Chaldean/SyriacAustralianAustrianBahamianBangladeshiBarbadianBasqueBelgianBelizeanBermudanBhutaneseBlackfeetBolivianBrazilianBritishBritish West IndianBulgarianBurmeseCajunCambodianCanadianCape VerdeanCarpatho RusynCelticCentral AmericanCentral American IndianCherokeeCheyenneChickasawChileanChineseChippewaChoctawColombianColvilleComancheCosta RicanCreeCreekCroatianCrowCubanCypriotCzechCzechoslovakianDanishDelawareDominicanDutchDutch West IndianEastern EuropeanEcuadorianEgyptianEnglishEstonianEthiopianEuropeanFijianFilipinoFinnishFrenchFrench American IndianFrench CanadianGermanGerman RussianGhanaianGreekGuamanian/ChamorroGuatemalanGuyaneseHaitianHmongHonduranHopiHoumaHungarianIcelanderIndian (Asian)IndonesianInupiatIranianIraqiIrishIroquoisIsraeliItalianJamaicanJapaneseJordanianKenyanKiowaKoreanLaotianLatvianLebaneseLiberianLithuanianLumbeeLuxembourgerMacedonianMalaysianMalteseMarshalleseMenomineeMexicanMexican American IndianMongolianMoroccanNative HawaiianNavajoNepaleseNew ZealanderNicaraguanNigerianNorthern EuropeanNorwegianOkinawanOsageOttawaPaiutePakistaniPalestinianPanamanianParaguayanPennsylvania GermanPeruvianPimaPolishPortuguesePotawatomiPuebloPuerto RicanPuget Sound SalishRomanianRussianSalvadoranSamoanScandinavianScotch-IrishScottishSeminoleSenegaleseSerbianShoshoneSierra LeoneanSiouxSlavicSlovakSloveneSomaliSouth AfricanSouth AmericanSouth American IndianSoviet UnionSpaniardSpanishSpanish AmericanSpanish American IndianSri LankanSubsaharan AfricanSudaneseSwedishSwissSyrianTaiwaneseThaiTlingit-HaidaTohono O'OdhamTonganTrinidadian and TobagonianTsimshianTurkishU.S. Virgin IslanderUgandanUkrainianUruguayanUteVenezuelanWelshWest IndianYakamaYaquiYugoslavianYumanYup'ikZimbabwean
Immigration
NonimmigrantsImmigrantsAfghanistanAfricaAlbaniaArgentinaArmeniaAsiaAustraliaAustriaBahamasBangladeshBarbadosBelarusBelgiumBelizeBoliviaBosnia and HerzegovinaBrazilBulgariaBurma/MyanmarCabo VerdeCambodiaCameroonCanadaCaribbeanCentral AmericaChileChinaColombiaCongoCosta RicaCroatiaCubaCzechoslovakiaDenmarkDominicaDominican RepublicEastern AfricaEastern AsiaEastern EuropeEcuadorEgyptEl SalvadorEnglandEritreaEthiopiaEuropeFijiFranceGermanyGhanaGreeceGrenadaGuatemalaGuyanaHaitiHondurasHong KongHungaryIndiaIndonesiaIranIraqIrelandIsraelItalyJamaicaJapanJordanKazakhstanKenyaKoreaKuwaitLaosLatin AmericaLatviaLebanonLiberiaLithuaniaMalaysiaMexicoMicronesiaMiddle AfricaMoldovaMoroccoNepalNetherlandsNicaraguaNigeriaNorth AmericaNorth MacedoniaNorthern AfricaNorthern EuropeNorwayOceaniaPakistanPanamaPeruPhilippinesPolandPortugalRomaniaRussiaSaudi ArabiaScotlandSenegalSerbiaSierra LeoneSingaporeSomaliaSouth AfricaSouth AmericaSouth Central AsiaSouth Eastern AsiaSouthern EuropeSpainSri LankaSt. Vincent and the GrenadinesSudanSwedenSwitzerlandSyriaTaiwanThailandTrinidad and TobagoTurkeyUgandaUkraineUruguayUzbekistanVenezuelaVietnamWest IndiesWestern AfricaWestern AsiaWestern EuropeYemenZaireZimbabweAzores
Vietnamese
Race
Ancestry
AfghanAfricanAlaska NativeAlaskan AthabascanAlbanianAleutAlsatianAmericanApacheArabArapahoArgentineanArmenianAssyrian/Chaldean/SyriacAustralianAustrianBahamianBangladeshiBarbadianBasqueBelgianBelizeanBermudanBhutaneseBlackfeetBolivianBrazilianBritishBritish West IndianBulgarianBurmeseCajunCambodianCanadianCape VerdeanCarpatho RusynCelticCentral AmericanCentral American IndianCherokeeCheyenneChickasawChileanChineseChippewaChoctawColombianColvilleComancheCosta RicanCreeCreekCroatianCrowCubanCypriotCzechCzechoslovakianDanishDelawareDominicanDutchDutch West IndianEastern EuropeanEcuadorianEgyptianEnglishEstonianEthiopianEuropeanFijianFilipinoFinnishFrenchFrench American IndianFrench CanadianGermanGerman RussianGhanaianGreekGuamanian/ChamorroGuatemalanGuyaneseHaitianHmongHonduranHopiHoumaHungarianIcelanderIndian (Asian)IndonesianInupiatIranianIraqiIrishIroquoisIsraeliItalianJamaicanJapaneseJordanianKenyanKiowaKoreanLaotianLatvianLebaneseLiberianLithuanianLumbeeLuxembourgerMacedonianMalaysianMalteseMarshalleseMenomineeMexicanMexican American IndianMongolianMoroccanNative HawaiianNavajoNepaleseNew ZealanderNicaraguanNigerianNorthern EuropeanNorwegianOkinawanOsageOttawaPaiutePakistaniPalestinianPanamanianParaguayanPennsylvania GermanPeruvianPimaPolishPortuguesePotawatomiPuebloPuerto RicanPuget Sound SalishRomanianRussianSalvadoranSamoanScandinavianScotch-IrishScottishSeminoleSenegaleseSerbianShoshoneSierra LeoneanSiouxSlavicSlovakSloveneSomaliSouth AfricanSouth AmericanSouth American IndianSoviet UnionSpaniardSpanishSpanish AmericanSpanish American IndianSri LankanSubsaharan AfricanSudaneseSwedishSwissSyrianTaiwaneseThaiTohono O'OdhamTonganTrinidadian and TobagonianTsimshianTurkishU.S. Virgin IslanderUgandanUkrainianUruguayanUteVenezuelanVietnameseWelshWest IndianYakamaYaquiYugoslavianYumanYup'ikZimbabwean
Immigration
NonimmigrantsImmigrantsAfghanistanAfricaAlbaniaArgentinaArmeniaAsiaAustraliaAustriaBahamasBangladeshBarbadosBelarusBelgiumBelizeBoliviaBosnia and HerzegovinaBrazilBulgariaBurma/MyanmarCabo VerdeCambodiaCameroonCanadaCaribbeanCentral AmericaChileChinaColombiaCongoCosta RicaCroatiaCubaCzechoslovakiaDenmarkDominicaDominican RepublicEastern AfricaEastern AsiaEastern EuropeEcuadorEgyptEl SalvadorEnglandEritreaEthiopiaEuropeFijiFranceGermanyGhanaGreeceGrenadaGuatemalaGuyanaHaitiHondurasHong KongHungaryIndiaIndonesiaIranIraqIrelandIsraelItalyJamaicaJapanJordanKazakhstanKenyaKoreaKuwaitLaosLatin AmericaLatviaLebanonLiberiaLithuaniaMalaysiaMexicoMicronesiaMiddle AfricaMoldovaMoroccoNepalNetherlandsNicaraguaNigeriaNorth AmericaNorth MacedoniaNorthern AfricaNorthern EuropeNorwayOceaniaPakistanPanamaPeruPhilippinesPolandPortugalRomaniaRussiaSaudi ArabiaScotlandSenegalSerbiaSierra LeoneSingaporeSomaliaSouth AfricaSouth AmericaSouth Central AsiaSouth Eastern AsiaSouthern EuropeSpainSri LankaSt. Vincent and the GrenadinesSudanSwedenSwitzerlandSyriaTaiwanThailandTrinidad and TobagoTurkeyUgandaUkraineUruguayUzbekistanVenezuelaVietnamWest IndiesWestern AfricaWestern AsiaWestern EuropeYemenZaireZimbabweAzores
Disability Age 35 to 64
Income
Poverty
Unemployment
Labor Participation
Family Structure
Vehicle Availability
Education Level
Disability

Disability Age 35 to 64 Comparison

Tlingit-Haida

Vietnamese

Tragic
Exceptional
13.2%
DISABILITY AGE 35 TO 64
0.0/ 100
METRIC RATING
287th/ 347
METRIC RANK
10.6%
DISABILITY AGE 35 TO 64
95.4/ 100
METRIC RATING
120th/ 347
METRIC RANK

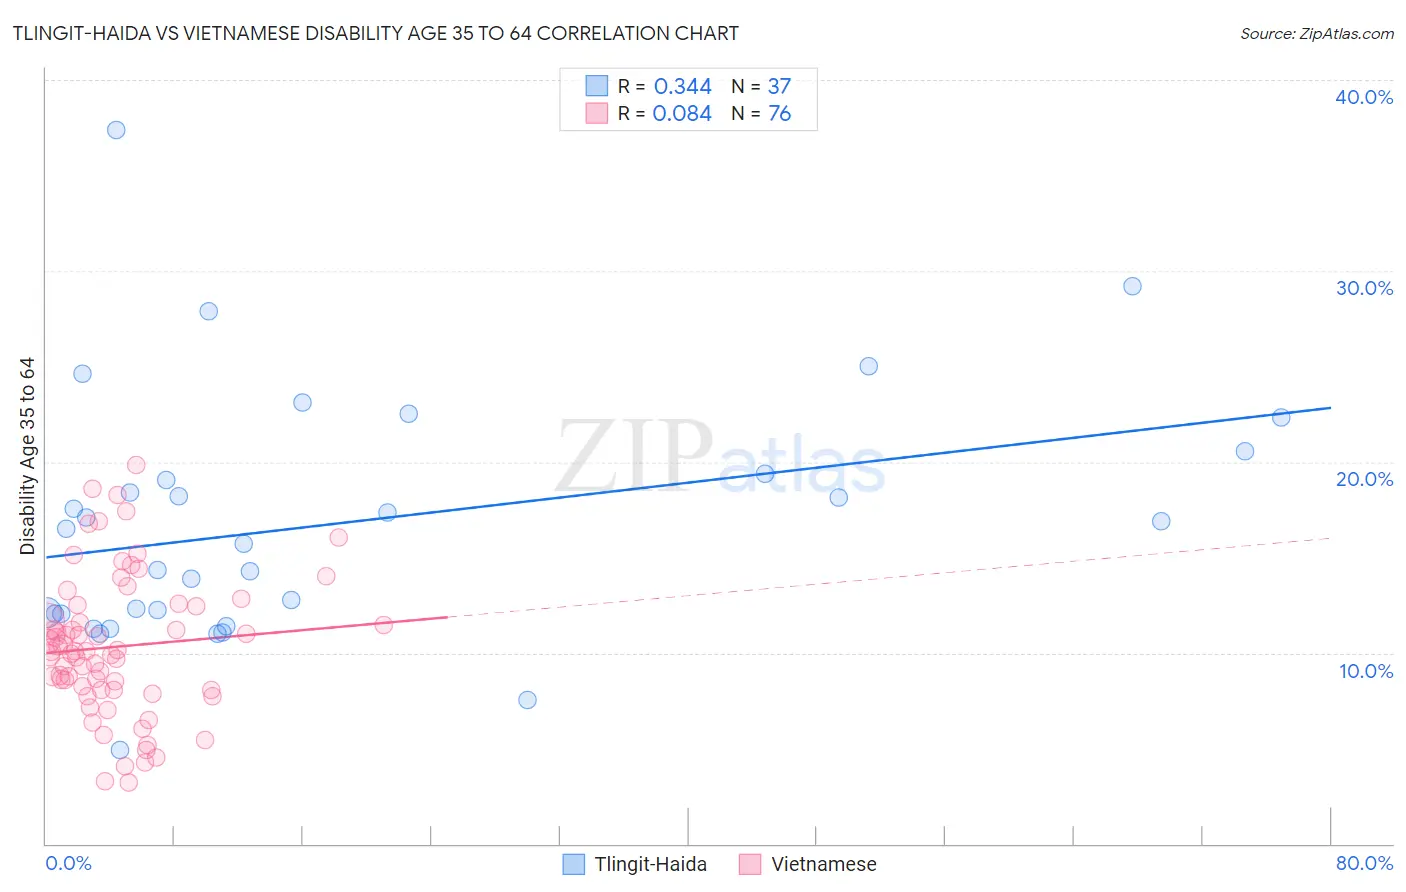
Tlingit-Haida vs Vietnamese Disability Age 35 to 64 Correlation Chart

The statistical analysis conducted on geographies consisting of 60,853,720 people shows a mild positive correlation between the proportion of Tlingit-Haida and percentage of population with a disability between the ages 34 and 64 in the United States with a correlation coefficient (R) of 0.344 and weighted average of 13.2%. Similarly, the statistical analysis conducted on geographies consisting of 170,653,846 people shows a slight positive correlation between the proportion of Vietnamese and percentage of population with a disability between the ages 34 and 64 in the United States with a correlation coefficient (R) of 0.084 and weighted average of 10.6%, a difference of 24.5%.
Tlingit-Haida vs Vietnamese Disability Age 35 to 64

Disability Age 35 to 64 Correlation Summary

MeasurementTlingit-HaidaVietnamese
Minimum4.9%3.2%
Maximum37.4%19.9%
Range32.4%16.7%
Mean16.8%10.3%
Median16.5%10.1%
Interquartile 25% (IQ1)12.1%8.0%
Interquartile 75% (IQ3)20.0%12.5%
Interquartile Range (IQR)7.9%4.4%
Standard Deviation (Sample)6.5%3.7%
Standard Deviation (Population)6.4%3.6%

Similar Demographics by Disability Age 35 to 64

Demographics Similar to Tlingit-Haida by Disability Age 35 to 64

In terms of disability age 35 to 64, the demographic groups most similar to Tlingit-Haida are Hmong (13.1%, a difference of 0.27%), Fijian (13.2%, a difference of 0.35%), Indonesian (13.2%, a difference of 0.42%), Immigrants from Liberia (13.2%, a difference of 0.50%), and Immigrants from Somalia (13.1%, a difference of 0.58%).
DemographicsRating | RankDisability Age 35 to 64
Liberians
0.1
/100
|
#280
Tragic
12.9%
Scotch-Irish
0.1
/100
|
#281
Tragic
13.0%
Immigrants | Laos
0.1
/100
|
#282
Tragic
13.0%
Central American Indians
0.0
/100
|
#283
Tragic
13.0%
Immigrants | Nonimmigrants
0.0
/100
|
#284
Tragic
13.0%
Immigrants | Somalia
0.0
/100
|
#285
Tragic
13.1%
Hmong
0.0
/100
|
#286
Tragic
13.1%
Tlingit-Haida
0.0
/100
|
#287
Tragic
13.2%
Fijians
0.0
/100
|
#288
Tragic
13.2%
Indonesians
0.0
/100
|
#289
Tragic
13.2%
Immigrants | Liberia
0.0
/100
|
#290
Tragic
13.2%
Immigrants | Congo
0.0
/100
|
#291
Tragic
13.3%
Puget Sound Salish
0.0
/100
|
#292
Tragic
13.3%
Ute
0.0
/100
|
#293
Tragic
13.4%
Yaqui
0.0
/100
|
#294
Tragic
13.5%

Demographics Similar to Vietnamese by Disability Age 35 to 64

In terms of disability age 35 to 64, the demographic groups most similar to Vietnamese are Luxembourger (10.6%, a difference of 0.020%), Immigrants from Moldova (10.6%, a difference of 0.070%), Immigrants from South Eastern Asia (10.6%, a difference of 0.16%), Romanian (10.6%, a difference of 0.17%), and Immigrants from Norway (10.6%, a difference of 0.20%).
DemographicsRating | RankDisability Age 35 to 64
Tongans
96.6
/100
|
#113
Exceptional
10.5%
Immigrants | Morocco
96.6
/100
|
#114
Exceptional
10.5%
Immigrants | Netherlands
96.3
/100
|
#115
Exceptional
10.5%
Immigrants | Nepal
95.9
/100
|
#116
Exceptional
10.6%
Immigrants | South Eastern Asia
95.7
/100
|
#117
Exceptional
10.6%
Immigrants | Moldova
95.5
/100
|
#118
Exceptional
10.6%
Luxembourgers
95.5
/100
|
#119
Exceptional
10.6%
Vietnamese
95.4
/100
|
#120
Exceptional
10.6%
Romanians
95.0
/100
|
#121
Exceptional
10.6%
Immigrants | Norway
95.0
/100
|
#122
Exceptional
10.6%
Maltese
94.8
/100
|
#123
Exceptional
10.6%
Estonians
94.5
/100
|
#124
Exceptional
10.6%
Albanians
94.2
/100
|
#125
Exceptional
10.6%
Immigrants | Afghanistan
94.1
/100
|
#126
Exceptional
10.6%
Immigrants | Zimbabwe
94.0
/100
|
#127
Exceptional
10.6%