Tlingit-Haida vs Peruvian Disability Age 35 to 64
COMPARE
Tlingit-Haida
Peruvian
Disability Age 35 to 64
Disability Age 35 to 64 Comparison
Tlingit-Haida
Peruvians
13.2%
DISABILITY AGE 35 TO 64
0.0/ 100
METRIC RATING
287th/ 347
METRIC RANK
9.9%
DISABILITY AGE 35 TO 64
99.8/ 100
METRIC RATING
55th/ 347
METRIC RANK
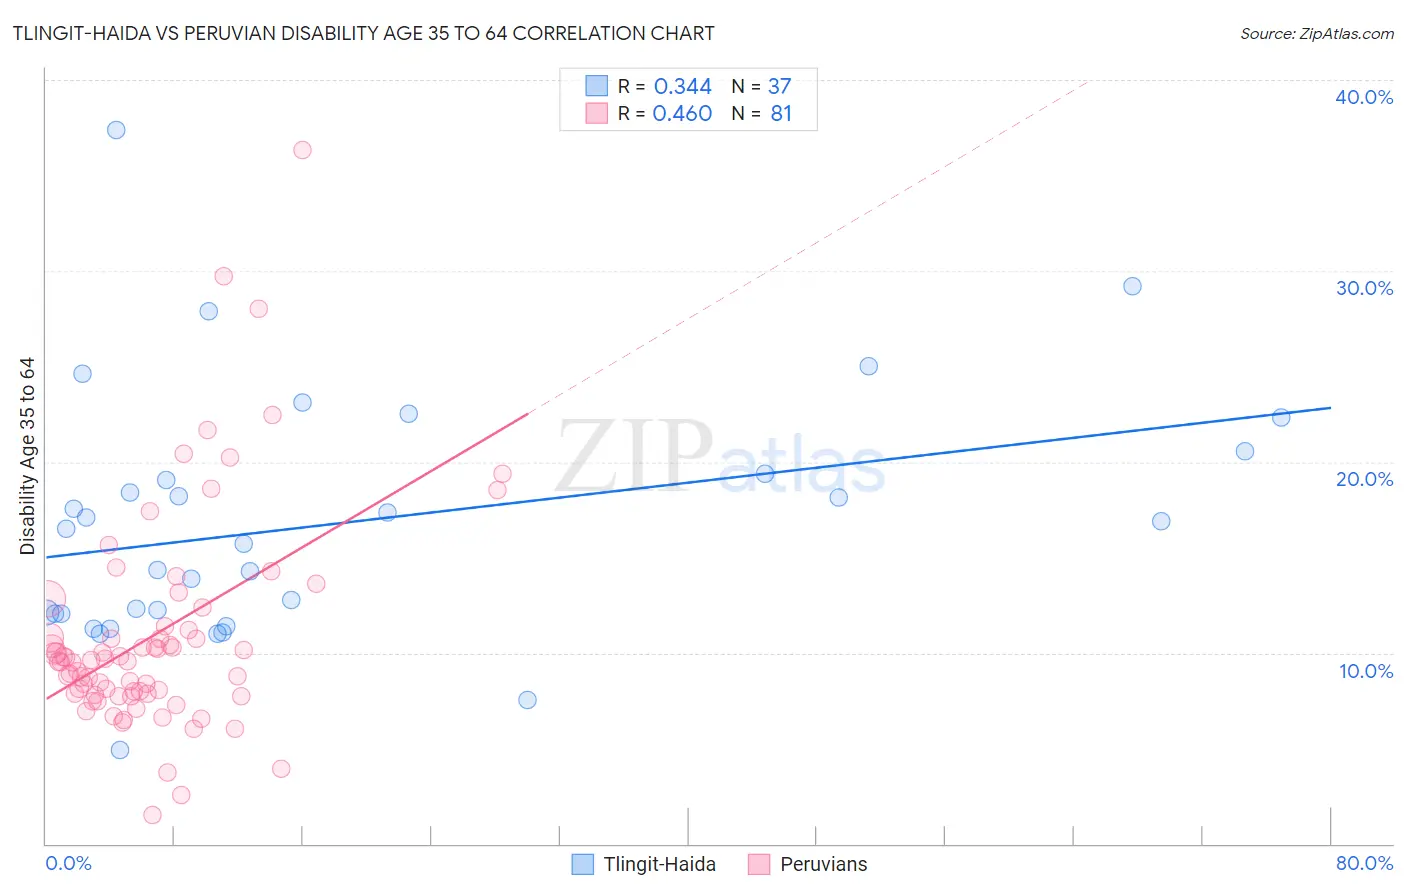
Tlingit-Haida vs Peruvian Disability Age 35 to 64 Correlation Chart
The statistical analysis conducted on geographies consisting of 60,853,720 people shows a mild positive correlation between the proportion of Tlingit-Haida and percentage of population with a disability between the ages 34 and 64 in the United States with a correlation coefficient (R) of 0.344 and weighted average of 13.2%. Similarly, the statistical analysis conducted on geographies consisting of 362,944,439 people shows a moderate positive correlation between the proportion of Peruvians and percentage of population with a disability between the ages 34 and 64 in the United States with a correlation coefficient (R) of 0.460 and weighted average of 9.9%, a difference of 33.7%.
Disability Age 35 to 64 Correlation Summary
| Measurement | Tlingit-Haida | Peruvian |
| Minimum | 4.9% | 1.5% |
| Maximum | 37.4% | 36.3% |
| Range | 32.4% | 34.8% |
| Mean | 16.8% | 10.9% |
| Median | 16.5% | 9.6% |
| Interquartile 25% (IQ1) | 12.1% | 7.8% |
| Interquartile 75% (IQ3) | 20.0% | 11.3% |
| Interquartile Range (IQR) | 7.9% | 3.5% |
| Standard Deviation (Sample) | 6.5% | 5.8% |
| Standard Deviation (Population) | 6.4% | 5.7% |
Similar Demographics by Disability Age 35 to 64
Demographics Similar to Tlingit-Haida by Disability Age 35 to 64
In terms of disability age 35 to 64, the demographic groups most similar to Tlingit-Haida are Hmong (13.1%, a difference of 0.27%), Fijian (13.2%, a difference of 0.35%), Indonesian (13.2%, a difference of 0.42%), Immigrants from Liberia (13.2%, a difference of 0.50%), and Immigrants from Somalia (13.1%, a difference of 0.58%).
| Demographics | Rating | Rank | Disability Age 35 to 64 |
| Liberians | 0.1 /100 | #280 | Tragic 12.9% |
| Scotch-Irish | 0.1 /100 | #281 | Tragic 13.0% |
| Immigrants | Laos | 0.1 /100 | #282 | Tragic 13.0% |
| Central American Indians | 0.0 /100 | #283 | Tragic 13.0% |
| Immigrants | Nonimmigrants | 0.0 /100 | #284 | Tragic 13.0% |
| Immigrants | Somalia | 0.0 /100 | #285 | Tragic 13.1% |
| Hmong | 0.0 /100 | #286 | Tragic 13.1% |
| Tlingit-Haida | 0.0 /100 | #287 | Tragic 13.2% |
| Fijians | 0.0 /100 | #288 | Tragic 13.2% |
| Indonesians | 0.0 /100 | #289 | Tragic 13.2% |
| Immigrants | Liberia | 0.0 /100 | #290 | Tragic 13.2% |
| Immigrants | Congo | 0.0 /100 | #291 | Tragic 13.3% |
| Puget Sound Salish | 0.0 /100 | #292 | Tragic 13.3% |
| Ute | 0.0 /100 | #293 | Tragic 13.4% |
| Yaqui | 0.0 /100 | #294 | Tragic 13.5% |
Demographics Similar to Peruvians by Disability Age 35 to 64
In terms of disability age 35 to 64, the demographic groups most similar to Peruvians are Immigrants from Russia (9.8%, a difference of 0.060%), Taiwanese (9.8%, a difference of 0.10%), Immigrants from Bulgaria (9.8%, a difference of 0.16%), Bhutanese (9.8%, a difference of 0.17%), and South American (9.9%, a difference of 0.22%).
| Demographics | Rating | Rank | Disability Age 35 to 64 |
| Immigrants | Serbia | 99.8 /100 | #48 | Exceptional 9.8% |
| Immigrants | Greece | 99.8 /100 | #49 | Exceptional 9.8% |
| Paraguayans | 99.8 /100 | #50 | Exceptional 9.8% |
| Bhutanese | 99.8 /100 | #51 | Exceptional 9.8% |
| Immigrants | Bulgaria | 99.8 /100 | #52 | Exceptional 9.8% |
| Taiwanese | 99.8 /100 | #53 | Exceptional 9.8% |
| Immigrants | Russia | 99.8 /100 | #54 | Exceptional 9.8% |
| Peruvians | 99.8 /100 | #55 | Exceptional 9.9% |
| South Americans | 99.8 /100 | #56 | Exceptional 9.9% |
| Colombians | 99.8 /100 | #57 | Exceptional 9.9% |
| Armenians | 99.8 /100 | #58 | Exceptional 9.9% |
| Immigrants | Sweden | 99.7 /100 | #59 | Exceptional 9.9% |
| Immigrants | South America | 99.7 /100 | #60 | Exceptional 9.9% |
| Immigrants | Spain | 99.7 /100 | #61 | Exceptional 10.0% |
| Eastern Europeans | 99.7 /100 | #62 | Exceptional 10.0% |