Tlingit-Haida vs Slavic Disability Age 35 to 64
COMPARE
Tlingit-Haida
Slavic
Disability Age 35 to 64
Disability Age 35 to 64 Comparison
Tlingit-Haida
Slavs
13.2%
DISABILITY AGE 35 TO 64
0.0/ 100
METRIC RATING
287th/ 347
METRIC RANK
11.7%
DISABILITY AGE 35 TO 64
15.5/ 100
METRIC RATING
205th/ 347
METRIC RANK
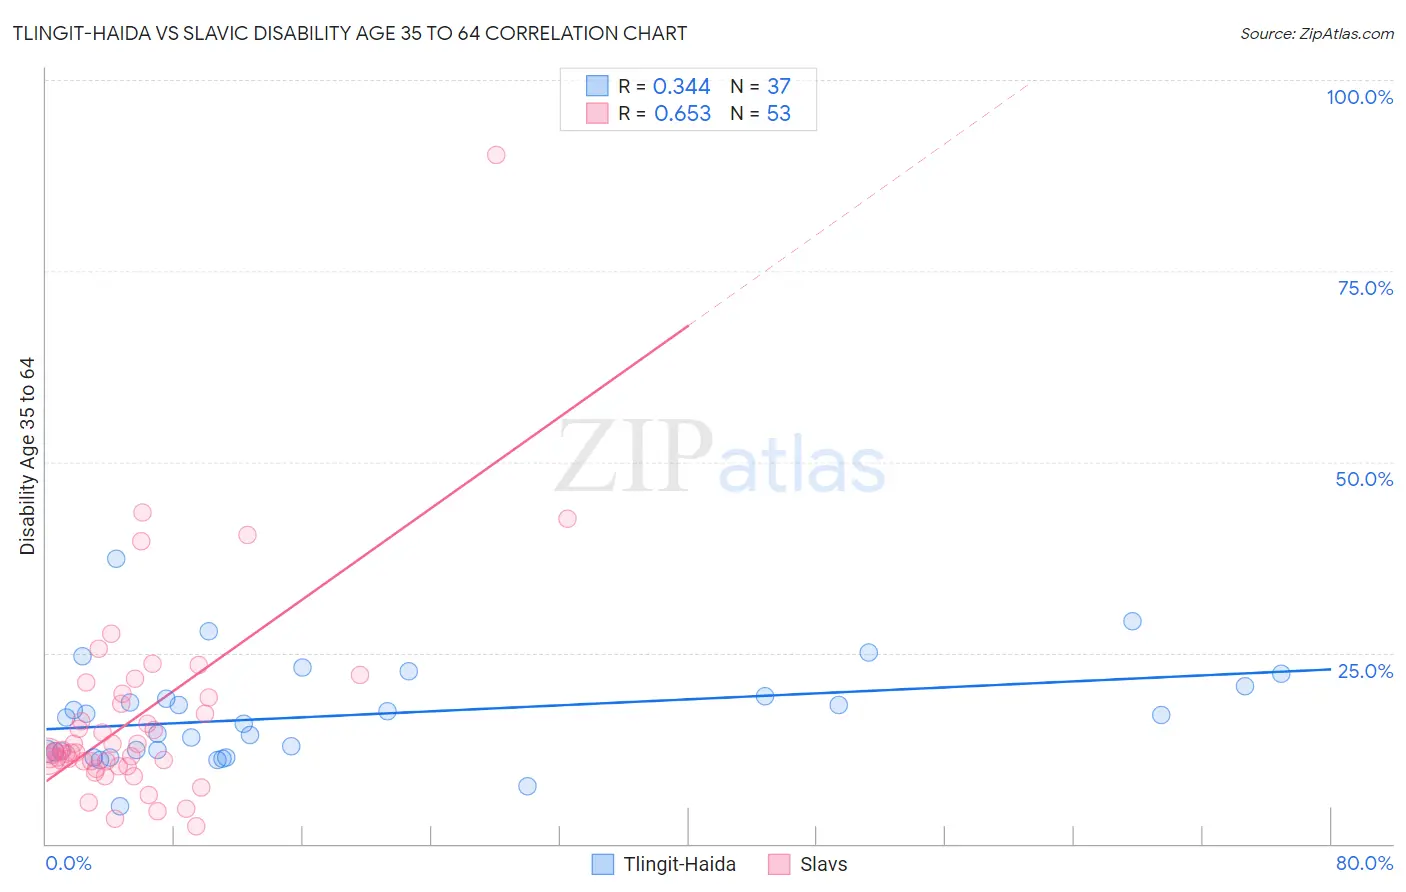
Tlingit-Haida vs Slavic Disability Age 35 to 64 Correlation Chart
The statistical analysis conducted on geographies consisting of 60,853,720 people shows a mild positive correlation between the proportion of Tlingit-Haida and percentage of population with a disability between the ages 34 and 64 in the United States with a correlation coefficient (R) of 0.344 and weighted average of 13.2%. Similarly, the statistical analysis conducted on geographies consisting of 270,786,875 people shows a significant positive correlation between the proportion of Slavs and percentage of population with a disability between the ages 34 and 64 in the United States with a correlation coefficient (R) of 0.653 and weighted average of 11.7%, a difference of 13.1%.
Disability Age 35 to 64 Correlation Summary
| Measurement | Tlingit-Haida | Slavic |
| Minimum | 4.9% | 2.3% |
| Maximum | 37.4% | 90.1% |
| Range | 32.4% | 87.9% |
| Mean | 16.8% | 16.7% |
| Median | 16.5% | 12.0% |
| Interquartile 25% (IQ1) | 12.1% | 10.5% |
| Interquartile 75% (IQ3) | 20.0% | 19.5% |
| Interquartile Range (IQR) | 7.9% | 9.0% |
| Standard Deviation (Sample) | 6.5% | 13.9% |
| Standard Deviation (Population) | 6.4% | 13.8% |
Similar Demographics by Disability Age 35 to 64
Demographics Similar to Tlingit-Haida by Disability Age 35 to 64
In terms of disability age 35 to 64, the demographic groups most similar to Tlingit-Haida are Hmong (13.1%, a difference of 0.27%), Fijian (13.2%, a difference of 0.35%), Indonesian (13.2%, a difference of 0.42%), Immigrants from Liberia (13.2%, a difference of 0.50%), and Immigrants from Somalia (13.1%, a difference of 0.58%).
| Demographics | Rating | Rank | Disability Age 35 to 64 |
| Liberians | 0.1 /100 | #280 | Tragic 12.9% |
| Scotch-Irish | 0.1 /100 | #281 | Tragic 13.0% |
| Immigrants | Laos | 0.1 /100 | #282 | Tragic 13.0% |
| Central American Indians | 0.0 /100 | #283 | Tragic 13.0% |
| Immigrants | Nonimmigrants | 0.0 /100 | #284 | Tragic 13.0% |
| Immigrants | Somalia | 0.0 /100 | #285 | Tragic 13.1% |
| Hmong | 0.0 /100 | #286 | Tragic 13.1% |
| Tlingit-Haida | 0.0 /100 | #287 | Tragic 13.2% |
| Fijians | 0.0 /100 | #288 | Tragic 13.2% |
| Indonesians | 0.0 /100 | #289 | Tragic 13.2% |
| Immigrants | Liberia | 0.0 /100 | #290 | Tragic 13.2% |
| Immigrants | Congo | 0.0 /100 | #291 | Tragic 13.3% |
| Puget Sound Salish | 0.0 /100 | #292 | Tragic 13.3% |
| Ute | 0.0 /100 | #293 | Tragic 13.4% |
| Yaqui | 0.0 /100 | #294 | Tragic 13.5% |
Demographics Similar to Slavs by Disability Age 35 to 64
In terms of disability age 35 to 64, the demographic groups most similar to Slavs are Native Hawaiian (11.7%, a difference of 0.10%), Ghanaian (11.7%, a difference of 0.10%), Nigerian (11.6%, a difference of 0.11%), Guatemalan (11.7%, a difference of 0.13%), and British (11.6%, a difference of 0.22%).
| Demographics | Rating | Rank | Disability Age 35 to 64 |
| Immigrants | Panama | 20.4 /100 | #198 | Fair 11.6% |
| Basques | 19.5 /100 | #199 | Poor 11.6% |
| Swiss | 18.7 /100 | #200 | Poor 11.6% |
| Immigrants | Kenya | 17.7 /100 | #201 | Poor 11.6% |
| Immigrants | Guatemala | 17.5 /100 | #202 | Poor 11.6% |
| British | 17.0 /100 | #203 | Poor 11.6% |
| Nigerians | 16.3 /100 | #204 | Poor 11.6% |
| Slavs | 15.5 /100 | #205 | Poor 11.7% |
| Native Hawaiians | 14.8 /100 | #206 | Poor 11.7% |
| Ghanaians | 14.8 /100 | #207 | Poor 11.7% |
| Guatemalans | 14.6 /100 | #208 | Poor 11.7% |
| Europeans | 13.5 /100 | #209 | Poor 11.7% |
| Belgians | 13.1 /100 | #210 | Poor 11.7% |
| Canadians | 13.0 /100 | #211 | Poor 11.7% |
| Immigrants | Jamaica | 11.8 /100 | #212 | Poor 11.7% |