Tlingit-Haida vs Korean Disability Age 35 to 64
COMPARE
Tlingit-Haida
Korean
Disability Age 35 to 64
Disability Age 35 to 64 Comparison
Tlingit-Haida
Koreans
13.2%
DISABILITY AGE 35 TO 64
0.0/ 100
METRIC RATING
287th/ 347
METRIC RANK
10.5%
DISABILITY AGE 35 TO 64
97.1/ 100
METRIC RATING
110th/ 347
METRIC RANK
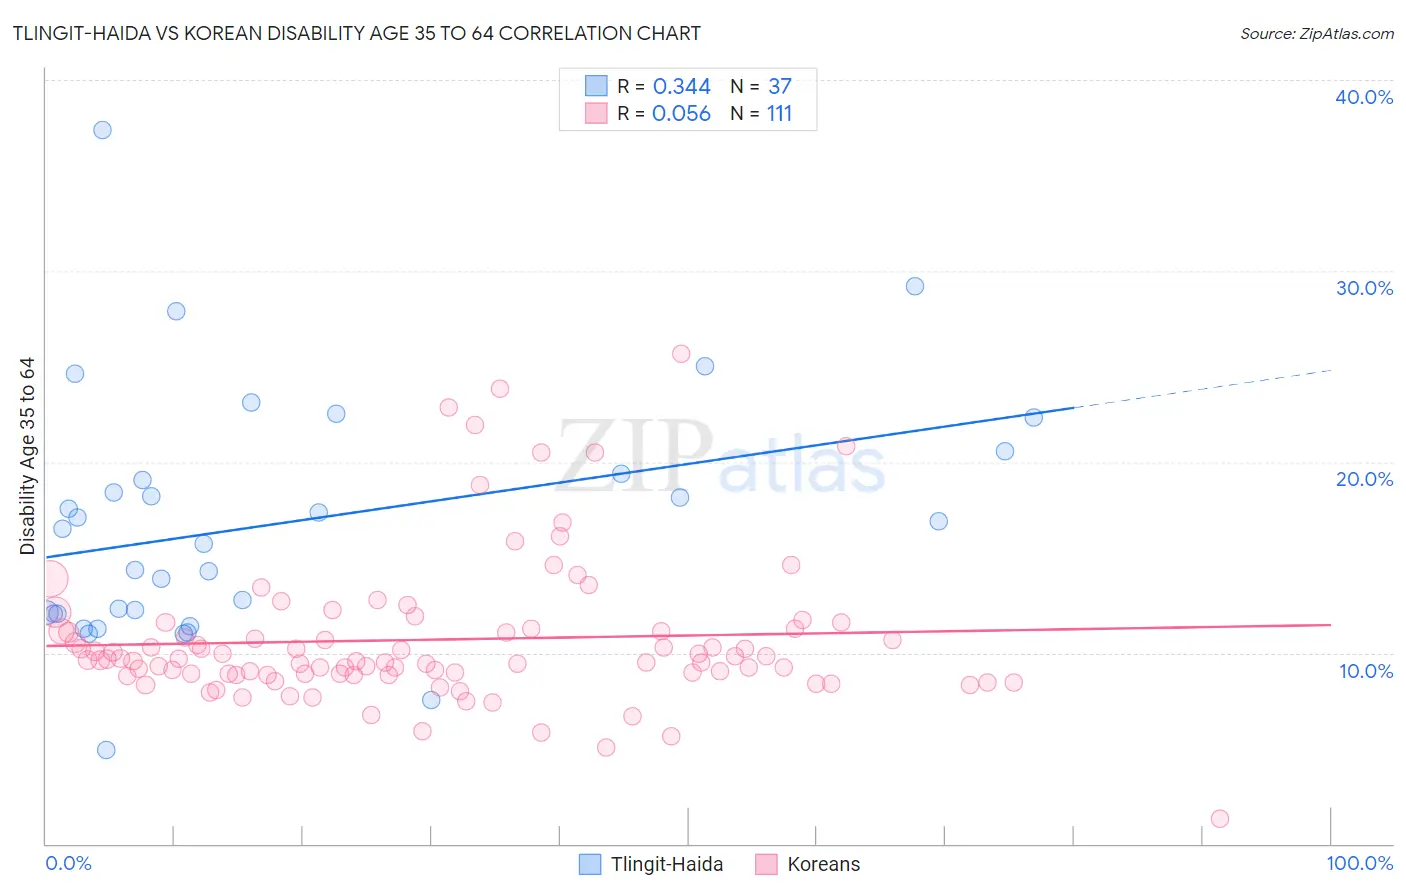
Tlingit-Haida vs Korean Disability Age 35 to 64 Correlation Chart
The statistical analysis conducted on geographies consisting of 60,853,720 people shows a mild positive correlation between the proportion of Tlingit-Haida and percentage of population with a disability between the ages 34 and 64 in the United States with a correlation coefficient (R) of 0.344 and weighted average of 13.2%. Similarly, the statistical analysis conducted on geographies consisting of 510,268,552 people shows a slight positive correlation between the proportion of Koreans and percentage of population with a disability between the ages 34 and 64 in the United States with a correlation coefficient (R) of 0.056 and weighted average of 10.5%, a difference of 25.8%.
Disability Age 35 to 64 Correlation Summary
| Measurement | Tlingit-Haida | Korean |
| Minimum | 4.9% | 1.3% |
| Maximum | 37.4% | 25.7% |
| Range | 32.4% | 24.4% |
| Mean | 16.8% | 10.7% |
| Median | 16.5% | 9.6% |
| Interquartile 25% (IQ1) | 12.1% | 8.9% |
| Interquartile 75% (IQ3) | 20.0% | 11.2% |
| Interquartile Range (IQR) | 7.9% | 2.4% |
| Standard Deviation (Sample) | 6.5% | 3.9% |
| Standard Deviation (Population) | 6.4% | 3.8% |
Similar Demographics by Disability Age 35 to 64
Demographics Similar to Tlingit-Haida by Disability Age 35 to 64
In terms of disability age 35 to 64, the demographic groups most similar to Tlingit-Haida are Hmong (13.1%, a difference of 0.27%), Fijian (13.2%, a difference of 0.35%), Indonesian (13.2%, a difference of 0.42%), Immigrants from Liberia (13.2%, a difference of 0.50%), and Immigrants from Somalia (13.1%, a difference of 0.58%).
| Demographics | Rating | Rank | Disability Age 35 to 64 |
| Liberians | 0.1 /100 | #280 | Tragic 12.9% |
| Scotch-Irish | 0.1 /100 | #281 | Tragic 13.0% |
| Immigrants | Laos | 0.1 /100 | #282 | Tragic 13.0% |
| Central American Indians | 0.0 /100 | #283 | Tragic 13.0% |
| Immigrants | Nonimmigrants | 0.0 /100 | #284 | Tragic 13.0% |
| Immigrants | Somalia | 0.0 /100 | #285 | Tragic 13.1% |
| Hmong | 0.0 /100 | #286 | Tragic 13.1% |
| Tlingit-Haida | 0.0 /100 | #287 | Tragic 13.2% |
| Fijians | 0.0 /100 | #288 | Tragic 13.2% |
| Indonesians | 0.0 /100 | #289 | Tragic 13.2% |
| Immigrants | Liberia | 0.0 /100 | #290 | Tragic 13.2% |
| Immigrants | Congo | 0.0 /100 | #291 | Tragic 13.3% |
| Puget Sound Salish | 0.0 /100 | #292 | Tragic 13.3% |
| Ute | 0.0 /100 | #293 | Tragic 13.4% |
| Yaqui | 0.0 /100 | #294 | Tragic 13.5% |
Demographics Similar to Koreans by Disability Age 35 to 64
In terms of disability age 35 to 64, the demographic groups most similar to Koreans are Immigrants from Ethiopia (10.5%, a difference of 0.060%), Ethiopian (10.5%, a difference of 0.20%), Brazilian (10.5%, a difference of 0.20%), Zimbabwean (10.4%, a difference of 0.22%), and Assyrian/Chaldean/Syriac (10.5%, a difference of 0.24%).
| Demographics | Rating | Rank | Disability Age 35 to 64 |
| Immigrants | Ukraine | 97.9 /100 | #103 | Exceptional 10.4% |
| Immigrants | Austria | 97.8 /100 | #104 | Exceptional 10.4% |
| Macedonians | 97.8 /100 | #105 | Exceptional 10.4% |
| Immigrants | Hungary | 97.6 /100 | #106 | Exceptional 10.4% |
| Zimbabweans | 97.4 /100 | #107 | Exceptional 10.4% |
| Ethiopians | 97.4 /100 | #108 | Exceptional 10.5% |
| Immigrants | Ethiopia | 97.2 /100 | #109 | Exceptional 10.5% |
| Koreans | 97.1 /100 | #110 | Exceptional 10.5% |
| Brazilians | 96.9 /100 | #111 | Exceptional 10.5% |
| Assyrians/Chaldeans/Syriacs | 96.8 /100 | #112 | Exceptional 10.5% |
| Tongans | 96.6 /100 | #113 | Exceptional 10.5% |
| Immigrants | Morocco | 96.6 /100 | #114 | Exceptional 10.5% |
| Immigrants | Netherlands | 96.3 /100 | #115 | Exceptional 10.5% |
| Immigrants | Nepal | 95.9 /100 | #116 | Exceptional 10.6% |
| Immigrants | South Eastern Asia | 95.7 /100 | #117 | Exceptional 10.6% |