Tlingit-Haida vs Welsh Disability Age 35 to 64
COMPARE
Tlingit-Haida
Welsh
Disability Age 35 to 64
Disability Age 35 to 64 Comparison
Tlingit-Haida
Welsh
13.2%
DISABILITY AGE 35 TO 64
0.0/ 100
METRIC RATING
287th/ 347
METRIC RANK
12.4%
DISABILITY AGE 35 TO 64
0.6/ 100
METRIC RATING
258th/ 347
METRIC RANK
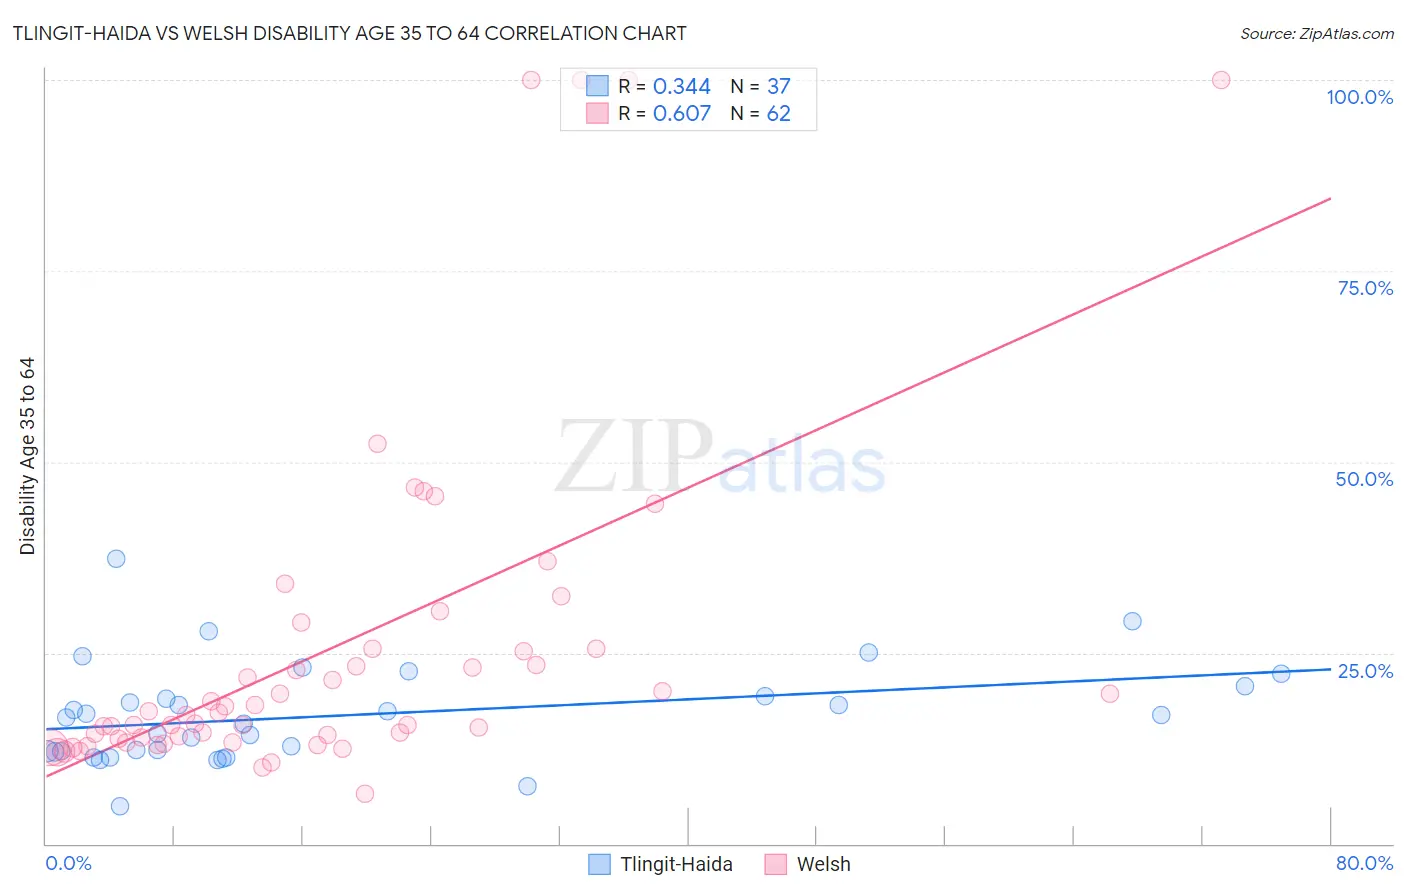
Tlingit-Haida vs Welsh Disability Age 35 to 64 Correlation Chart
The statistical analysis conducted on geographies consisting of 60,853,720 people shows a mild positive correlation between the proportion of Tlingit-Haida and percentage of population with a disability between the ages 34 and 64 in the United States with a correlation coefficient (R) of 0.344 and weighted average of 13.2%. Similarly, the statistical analysis conducted on geographies consisting of 527,956,367 people shows a significant positive correlation between the proportion of Welsh and percentage of population with a disability between the ages 34 and 64 in the United States with a correlation coefficient (R) of 0.607 and weighted average of 12.4%, a difference of 6.2%.
Disability Age 35 to 64 Correlation Summary
| Measurement | Tlingit-Haida | Welsh |
| Minimum | 4.9% | 6.5% |
| Maximum | 37.4% | 100.0% |
| Range | 32.4% | 93.5% |
| Mean | 16.8% | 25.5% |
| Median | 16.5% | 17.0% |
| Interquartile 25% (IQ1) | 12.1% | 13.8% |
| Interquartile 75% (IQ3) | 20.0% | 25.5% |
| Interquartile Range (IQR) | 7.9% | 11.7% |
| Standard Deviation (Sample) | 6.5% | 22.1% |
| Standard Deviation (Population) | 6.4% | 21.9% |
Similar Demographics by Disability Age 35 to 64
Demographics Similar to Tlingit-Haida by Disability Age 35 to 64
In terms of disability age 35 to 64, the demographic groups most similar to Tlingit-Haida are Hmong (13.1%, a difference of 0.27%), Fijian (13.2%, a difference of 0.35%), Indonesian (13.2%, a difference of 0.42%), Immigrants from Liberia (13.2%, a difference of 0.50%), and Immigrants from Somalia (13.1%, a difference of 0.58%).
| Demographics | Rating | Rank | Disability Age 35 to 64 |
| Liberians | 0.1 /100 | #280 | Tragic 12.9% |
| Scotch-Irish | 0.1 /100 | #281 | Tragic 13.0% |
| Immigrants | Laos | 0.1 /100 | #282 | Tragic 13.0% |
| Central American Indians | 0.0 /100 | #283 | Tragic 13.0% |
| Immigrants | Nonimmigrants | 0.0 /100 | #284 | Tragic 13.0% |
| Immigrants | Somalia | 0.0 /100 | #285 | Tragic 13.1% |
| Hmong | 0.0 /100 | #286 | Tragic 13.1% |
| Tlingit-Haida | 0.0 /100 | #287 | Tragic 13.2% |
| Fijians | 0.0 /100 | #288 | Tragic 13.2% |
| Indonesians | 0.0 /100 | #289 | Tragic 13.2% |
| Immigrants | Liberia | 0.0 /100 | #290 | Tragic 13.2% |
| Immigrants | Congo | 0.0 /100 | #291 | Tragic 13.3% |
| Puget Sound Salish | 0.0 /100 | #292 | Tragic 13.3% |
| Ute | 0.0 /100 | #293 | Tragic 13.4% |
| Yaqui | 0.0 /100 | #294 | Tragic 13.5% |
Demographics Similar to Welsh by Disability Age 35 to 64
In terms of disability age 35 to 64, the demographic groups most similar to Welsh are Mexican (12.4%, a difference of 0.080%), English (12.4%, a difference of 0.12%), Scottish (12.4%, a difference of 0.34%), German Russian (12.5%, a difference of 0.37%), and Japanese (12.3%, a difference of 0.51%).
| Demographics | Rating | Rank | Disability Age 35 to 64 |
| Germans | 1.1 /100 | #251 | Tragic 12.3% |
| Irish | 1.0 /100 | #252 | Tragic 12.3% |
| Dutch | 1.0 /100 | #253 | Tragic 12.3% |
| Hawaiians | 0.9 /100 | #254 | Tragic 12.3% |
| Japanese | 0.8 /100 | #255 | Tragic 12.3% |
| Scottish | 0.8 /100 | #256 | Tragic 12.4% |
| Mexicans | 0.7 /100 | #257 | Tragic 12.4% |
| Welsh | 0.6 /100 | #258 | Tragic 12.4% |
| English | 0.6 /100 | #259 | Tragic 12.4% |
| German Russians | 0.5 /100 | #260 | Tragic 12.5% |
| Malaysians | 0.5 /100 | #261 | Tragic 12.5% |
| Senegalese | 0.5 /100 | #262 | Tragic 12.5% |
| Immigrants | Zaire | 0.4 /100 | #263 | Tragic 12.5% |
| Immigrants | Portugal | 0.4 /100 | #264 | Tragic 12.5% |
| Marshallese | 0.4 /100 | #265 | Tragic 12.5% |