Chilean vs Cheyenne Disability Age 65 to 74
COMPARE
Chilean
Cheyenne
Disability Age 65 to 74
Disability Age 65 to 74 Comparison
Chileans
Cheyenne
22.0%
DISABILITY AGE 65 TO 74
97.9/ 100
METRIC RATING
91st/ 347
METRIC RANK
31.1%
DISABILITY AGE 65 TO 74
0.0/ 100
METRIC RATING
335th/ 347
METRIC RANK
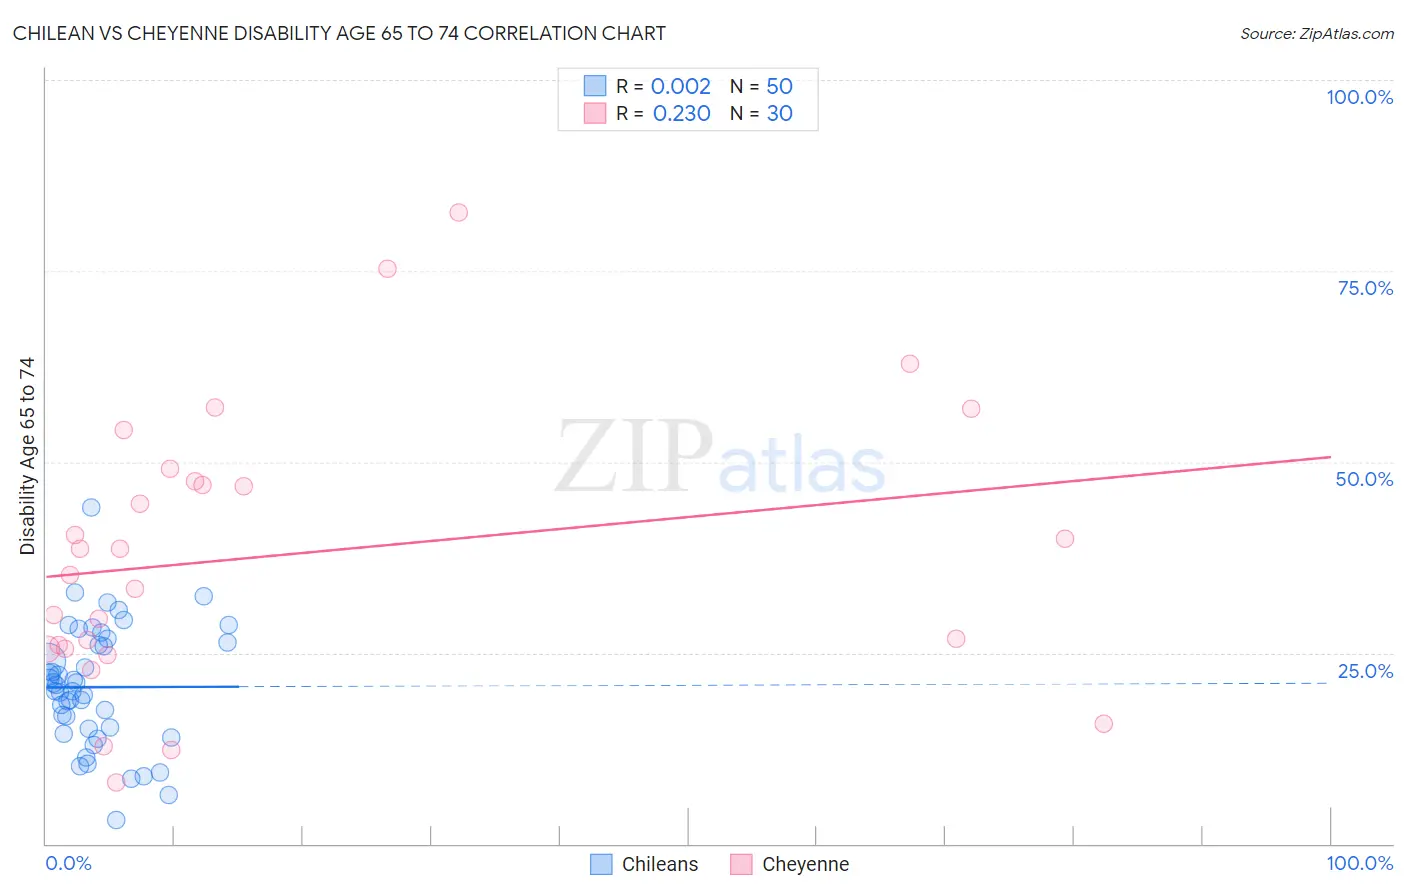
Chilean vs Cheyenne Disability Age 65 to 74 Correlation Chart
The statistical analysis conducted on geographies consisting of 256,368,241 people shows no correlation between the proportion of Chileans and percentage of population with a disability between the ages 65 and 75 in the United States with a correlation coefficient (R) of 0.002 and weighted average of 22.0%. Similarly, the statistical analysis conducted on geographies consisting of 80,698,325 people shows a weak positive correlation between the proportion of Cheyenne and percentage of population with a disability between the ages 65 and 75 in the United States with a correlation coefficient (R) of 0.230 and weighted average of 31.1%, a difference of 41.0%.
Disability Age 65 to 74 Correlation Summary
| Measurement | Chilean | Cheyenne |
| Minimum | 3.0% | 8.0% |
| Maximum | 43.9% | 82.6% |
| Range | 40.9% | 74.6% |
| Mean | 20.5% | 37.9% |
| Median | 20.4% | 36.9% |
| Interquartile 25% (IQ1) | 15.1% | 25.5% |
| Interquartile 75% (IQ3) | 26.3% | 47.5% |
| Interquartile Range (IQR) | 11.2% | 22.0% |
| Standard Deviation (Sample) | 8.0% | 18.0% |
| Standard Deviation (Population) | 7.9% | 17.7% |
Similar Demographics by Disability Age 65 to 74
Demographics Similar to Chileans by Disability Age 65 to 74
In terms of disability age 65 to 74, the demographic groups most similar to Chileans are Italian (22.0%, a difference of 0.020%), Immigrants from Kuwait (22.0%, a difference of 0.030%), Immigrants from Netherlands (22.0%, a difference of 0.040%), Australian (22.0%, a difference of 0.050%), and Polish (22.0%, a difference of 0.060%).
| Demographics | Rating | Rank | Disability Age 65 to 74 |
| Immigrants | Spain | 98.5 /100 | #84 | Exceptional 21.9% |
| Immigrants | Lebanon | 98.4 /100 | #85 | Exceptional 21.9% |
| South Africans | 98.4 /100 | #86 | Exceptional 21.9% |
| Australians | 98.0 /100 | #87 | Exceptional 22.0% |
| Immigrants | Netherlands | 97.9 /100 | #88 | Exceptional 22.0% |
| Immigrants | Kuwait | 97.9 /100 | #89 | Exceptional 22.0% |
| Italians | 97.9 /100 | #90 | Exceptional 22.0% |
| Chileans | 97.9 /100 | #91 | Exceptional 22.0% |
| Poles | 97.8 /100 | #92 | Exceptional 22.0% |
| Immigrants | Canada | 97.8 /100 | #93 | Exceptional 22.1% |
| Immigrants | Chile | 97.7 /100 | #94 | Exceptional 22.1% |
| Romanians | 97.7 /100 | #95 | Exceptional 22.1% |
| Immigrants | North America | 97.5 /100 | #96 | Exceptional 22.1% |
| Immigrants | Southern Europe | 97.2 /100 | #97 | Exceptional 22.1% |
| Jordanians | 96.9 /100 | #98 | Exceptional 22.2% |
Demographics Similar to Cheyenne by Disability Age 65 to 74
In terms of disability age 65 to 74, the demographic groups most similar to Cheyenne are Yuman (31.5%, a difference of 1.3%), Alaska Native (30.6%, a difference of 1.4%), Colville (30.5%, a difference of 1.7%), Native/Alaskan (30.4%, a difference of 2.2%), and Chickasaw (30.2%, a difference of 2.9%).
| Demographics | Rating | Rank | Disability Age 65 to 74 |
| Hopi | 0.0 /100 | #328 | Tragic 30.0% |
| Choctaw | 0.0 /100 | #329 | Tragic 30.2% |
| Creek | 0.0 /100 | #330 | Tragic 30.2% |
| Chickasaw | 0.0 /100 | #331 | Tragic 30.2% |
| Natives/Alaskans | 0.0 /100 | #332 | Tragic 30.4% |
| Colville | 0.0 /100 | #333 | Tragic 30.5% |
| Alaska Natives | 0.0 /100 | #334 | Tragic 30.6% |
| Cheyenne | 0.0 /100 | #335 | Tragic 31.1% |
| Yuman | 0.0 /100 | #336 | Tragic 31.5% |
| Houma | 0.0 /100 | #337 | Tragic 32.3% |
| Alaskan Athabascans | 0.0 /100 | #338 | Tragic 32.4% |
| Kiowa | 0.0 /100 | #339 | Tragic 32.6% |
| Lumbee | 0.0 /100 | #340 | Tragic 32.7% |
| Tsimshian | 0.0 /100 | #341 | Tragic 32.9% |
| Pueblo | 0.0 /100 | #342 | Tragic 33.1% |