Tlingit-Haida vs Cheyenne Family Households with Children
COMPARE
Tlingit-Haida
Cheyenne
Family Households with Children
Family Households with Children Comparison
Tlingit-Haida
Cheyenne
26.0%
FAMILY HOUSEHOLDS WITH CHILDREN
0.0/ 100
METRIC RATING
320th/ 347
METRIC RANK
27.4%
FAMILY HOUSEHOLDS WITH CHILDREN
35.1/ 100
METRIC RATING
196th/ 347
METRIC RANK
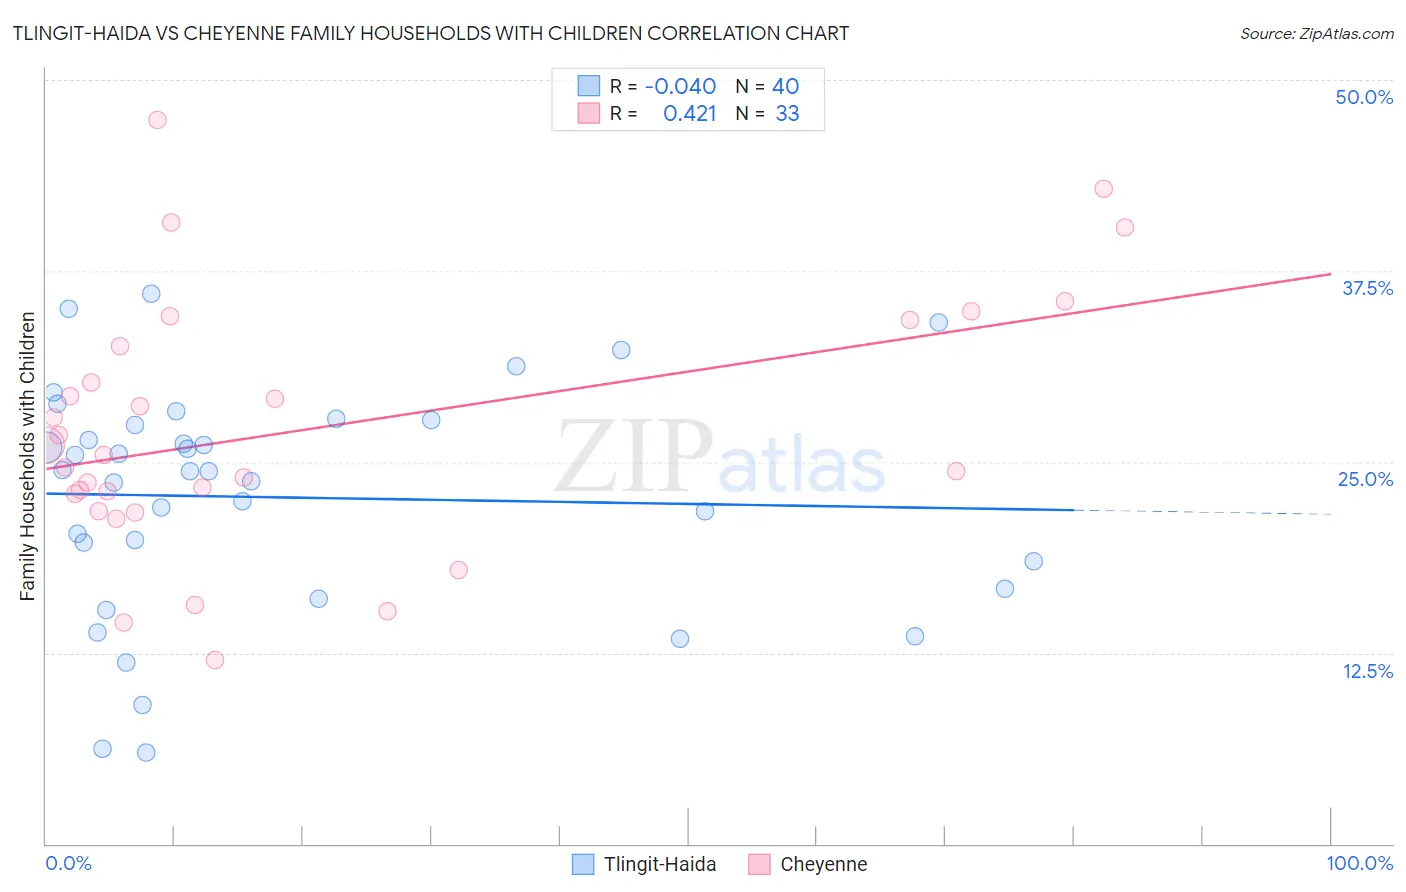
Tlingit-Haida vs Cheyenne Family Households with Children Correlation Chart
The statistical analysis conducted on geographies consisting of 60,854,309 people shows no correlation between the proportion of Tlingit-Haida and percentage of family households with children in the United States with a correlation coefficient (R) of -0.040 and weighted average of 26.0%. Similarly, the statistical analysis conducted on geographies consisting of 80,669,159 people shows a moderate positive correlation between the proportion of Cheyenne and percentage of family households with children in the United States with a correlation coefficient (R) of 0.421 and weighted average of 27.4%, a difference of 5.1%.
Family Households with Children Correlation Summary
| Measurement | Tlingit-Haida | Cheyenne |
| Minimum | 6.0% | 12.0% |
| Maximum | 36.0% | 47.4% |
| Range | 30.0% | 35.3% |
| Mean | 22.7% | 27.1% |
| Median | 24.4% | 25.4% |
| Interquartile 25% (IQ1) | 17.6% | 22.4% |
| Interquartile 75% (IQ3) | 27.6% | 33.4% |
| Interquartile Range (IQR) | 10.0% | 11.1% |
| Standard Deviation (Sample) | 7.5% | 8.4% |
| Standard Deviation (Population) | 7.4% | 8.2% |
Similar Demographics by Family Households with Children
Demographics Similar to Tlingit-Haida by Family Households with Children
In terms of family households with children, the demographic groups most similar to Tlingit-Haida are British West Indian (26.0%, a difference of 0.010%), Immigrants from France (26.0%, a difference of 0.020%), Immigrants from Greece (26.0%, a difference of 0.030%), Immigrants from Australia (26.0%, a difference of 0.060%), and Chinese (26.0%, a difference of 0.090%).
| Demographics | Rating | Rank | Family Households with Children |
| Cree | 0.0 /100 | #313 | Tragic 26.2% |
| French Canadians | 0.0 /100 | #314 | Tragic 26.1% |
| Immigrants | Norway | 0.0 /100 | #315 | Tragic 26.1% |
| Estonians | 0.0 /100 | #316 | Tragic 26.1% |
| Ottawa | 0.0 /100 | #317 | Tragic 26.1% |
| Iroquois | 0.0 /100 | #318 | Tragic 26.1% |
| Immigrants | France | 0.0 /100 | #319 | Tragic 26.0% |
| Tlingit-Haida | 0.0 /100 | #320 | Tragic 26.0% |
| British West Indians | 0.0 /100 | #321 | Tragic 26.0% |
| Immigrants | Greece | 0.0 /100 | #322 | Tragic 26.0% |
| Immigrants | Australia | 0.0 /100 | #323 | Tragic 26.0% |
| Chinese | 0.0 /100 | #324 | Tragic 26.0% |
| Barbadians | 0.0 /100 | #325 | Tragic 26.0% |
| Immigrants | Ireland | 0.0 /100 | #326 | Tragic 26.0% |
| Immigrants | Barbados | 0.0 /100 | #327 | Tragic 26.0% |
Demographics Similar to Cheyenne by Family Households with Children
In terms of family households with children, the demographic groups most similar to Cheyenne are Norwegian (27.4%, a difference of 0.0%), Immigrants from Iran (27.4%, a difference of 0.020%), Crow (27.4%, a difference of 0.020%), Immigrants from Romania (27.4%, a difference of 0.020%), and Swedish (27.4%, a difference of 0.040%).
| Demographics | Rating | Rank | Family Households with Children |
| Immigrants | Israel | 37.9 /100 | #189 | Fair 27.4% |
| Immigrants | Uruguay | 37.7 /100 | #190 | Fair 27.4% |
| Sudanese | 37.6 /100 | #191 | Fair 27.4% |
| Pennsylvania Germans | 37.5 /100 | #192 | Fair 27.4% |
| Swedes | 36.9 /100 | #193 | Fair 27.4% |
| Immigrants | Iran | 36.1 /100 | #194 | Fair 27.4% |
| Crow | 35.7 /100 | #195 | Fair 27.4% |
| Cheyenne | 35.1 /100 | #196 | Fair 27.4% |
| Norwegians | 35.0 /100 | #197 | Fair 27.4% |
| Immigrants | Romania | 34.4 /100 | #198 | Fair 27.4% |
| English | 32.0 /100 | #199 | Fair 27.3% |
| Immigrants | Congo | 28.7 /100 | #200 | Fair 27.3% |
| Bhutanese | 25.1 /100 | #201 | Fair 27.3% |
| Americans | 22.8 /100 | #202 | Fair 27.3% |
| Kiowa | 22.2 /100 | #203 | Fair 27.3% |