Immigrants from Bangladesh vs Yup'ik Disability
COMPARE
Immigrants from Bangladesh
Yup'ik
Disability
Disability Comparison
Immigrants from Bangladesh
Yup'ik
11.0%
DISABILITY
99.4/ 100
METRIC RATING
73rd/ 347
METRIC RANK
12.2%
DISABILITY
2.2/ 100
METRIC RATING
235th/ 347
METRIC RANK
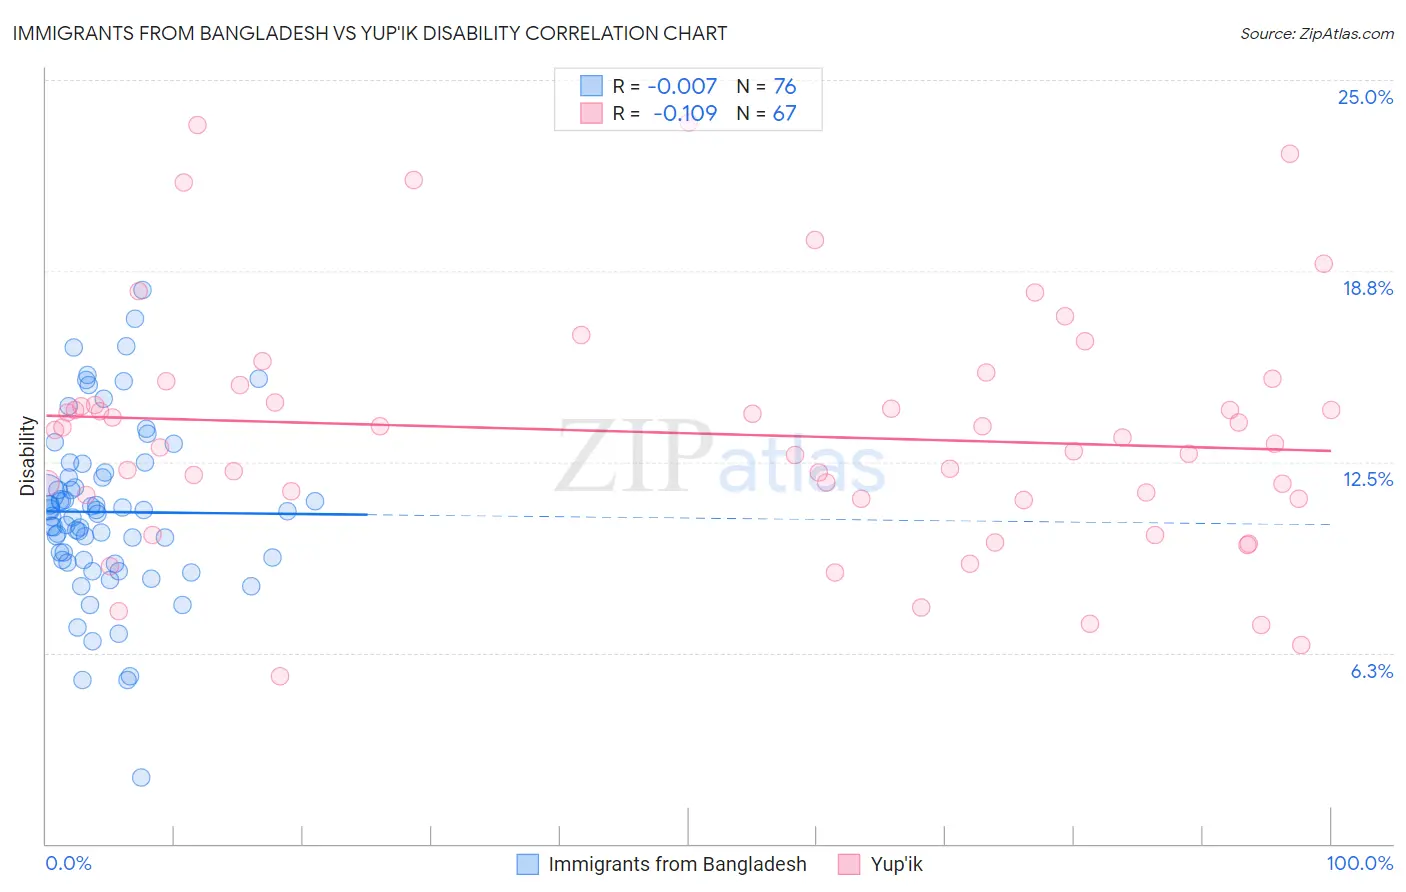
Immigrants from Bangladesh vs Yup'ik Disability Correlation Chart
The statistical analysis conducted on geographies consisting of 203,681,274 people shows no correlation between the proportion of Immigrants from Bangladesh and percentage of population with a disability in the United States with a correlation coefficient (R) of -0.007 and weighted average of 11.0%. Similarly, the statistical analysis conducted on geographies consisting of 39,961,482 people shows a poor negative correlation between the proportion of Yup'ik and percentage of population with a disability in the United States with a correlation coefficient (R) of -0.109 and weighted average of 12.2%, a difference of 10.4%.
Disability Correlation Summary
| Measurement | Immigrants from Bangladesh | Yup'ik |
| Minimum | 2.2% | 5.5% |
| Maximum | 18.1% | 23.6% |
| Range | 15.9% | 18.1% |
| Mean | 10.9% | 13.4% |
| Median | 10.8% | 13.3% |
| Interquartile 25% (IQ1) | 9.3% | 11.3% |
| Interquartile 75% (IQ3) | 12.1% | 15.0% |
| Interquartile Range (IQR) | 2.8% | 3.7% |
| Standard Deviation (Sample) | 2.8% | 3.9% |
| Standard Deviation (Population) | 2.8% | 3.9% |
Similar Demographics by Disability
Demographics Similar to Immigrants from Bangladesh by Disability
In terms of disability, the demographic groups most similar to Immigrants from Bangladesh are Immigrants from Serbia (11.0%, a difference of 0.020%), Immigrants from Chile (11.0%, a difference of 0.030%), Immigrants from Vietnam (11.0%, a difference of 0.040%), Sierra Leonean (11.0%, a difference of 0.070%), and Immigrants from Belgium (11.0%, a difference of 0.070%).
| Demographics | Rating | Rank | Disability |
| Laotians | 99.6 /100 | #66 | Exceptional 11.0% |
| Colombians | 99.6 /100 | #67 | Exceptional 11.0% |
| Immigrants | Afghanistan | 99.6 /100 | #68 | Exceptional 11.0% |
| Sri Lankans | 99.5 /100 | #69 | Exceptional 11.0% |
| Immigrants | France | 99.4 /100 | #70 | Exceptional 11.0% |
| Immigrants | Lebanon | 99.4 /100 | #71 | Exceptional 11.0% |
| Immigrants | Chile | 99.4 /100 | #72 | Exceptional 11.0% |
| Immigrants | Bangladesh | 99.4 /100 | #73 | Exceptional 11.0% |
| Immigrants | Serbia | 99.4 /100 | #74 | Exceptional 11.0% |
| Immigrants | Vietnam | 99.4 /100 | #75 | Exceptional 11.0% |
| Sierra Leoneans | 99.3 /100 | #76 | Exceptional 11.0% |
| Immigrants | Belgium | 99.3 /100 | #77 | Exceptional 11.0% |
| Immigrants | Cameroon | 99.3 /100 | #78 | Exceptional 11.1% |
| Immigrants | Jordan | 99.3 /100 | #79 | Exceptional 11.1% |
| Immigrants | Ireland | 99.3 /100 | #80 | Exceptional 11.1% |
Demographics Similar to Yup'ik by Disability
In terms of disability, the demographic groups most similar to Yup'ik are Japanese (12.2%, a difference of 0.040%), Bahamian (12.2%, a difference of 0.070%), Chinese (12.2%, a difference of 0.090%), Immigrants from Congo (12.2%, a difference of 0.14%), and Italian (12.2%, a difference of 0.16%).
| Demographics | Rating | Rank | Disability |
| West Indians | 2.9 /100 | #228 | Tragic 12.2% |
| Inupiat | 2.8 /100 | #229 | Tragic 12.2% |
| Samoans | 2.6 /100 | #230 | Tragic 12.2% |
| Malaysians | 2.5 /100 | #231 | Tragic 12.2% |
| Italians | 2.5 /100 | #232 | Tragic 12.2% |
| Bahamians | 2.3 /100 | #233 | Tragic 12.2% |
| Japanese | 2.3 /100 | #234 | Tragic 12.2% |
| Yup'ik | 2.2 /100 | #235 | Tragic 12.2% |
| Chinese | 2.0 /100 | #236 | Tragic 12.2% |
| Immigrants | Congo | 1.9 /100 | #237 | Tragic 12.2% |
| Norwegians | 1.9 /100 | #238 | Tragic 12.2% |
| Swedes | 1.8 /100 | #239 | Tragic 12.2% |
| Hungarians | 1.7 /100 | #240 | Tragic 12.2% |
| Yugoslavians | 1.7 /100 | #241 | Tragic 12.2% |
| Poles | 1.7 /100 | #242 | Tragic 12.2% |