Swiss vs Bermudan Single Father Households
COMPARE
Swiss
Bermudan
Single Father Households
Single Father Households Comparison
Swiss
Bermudans
2.3%
SINGLE FATHER HOUSEHOLDS
73.2/ 100
METRIC RATING
161st/ 347
METRIC RANK
2.1%
SINGLE FATHER HOUSEHOLDS
99.2/ 100
METRIC RATING
95th/ 347
METRIC RANK
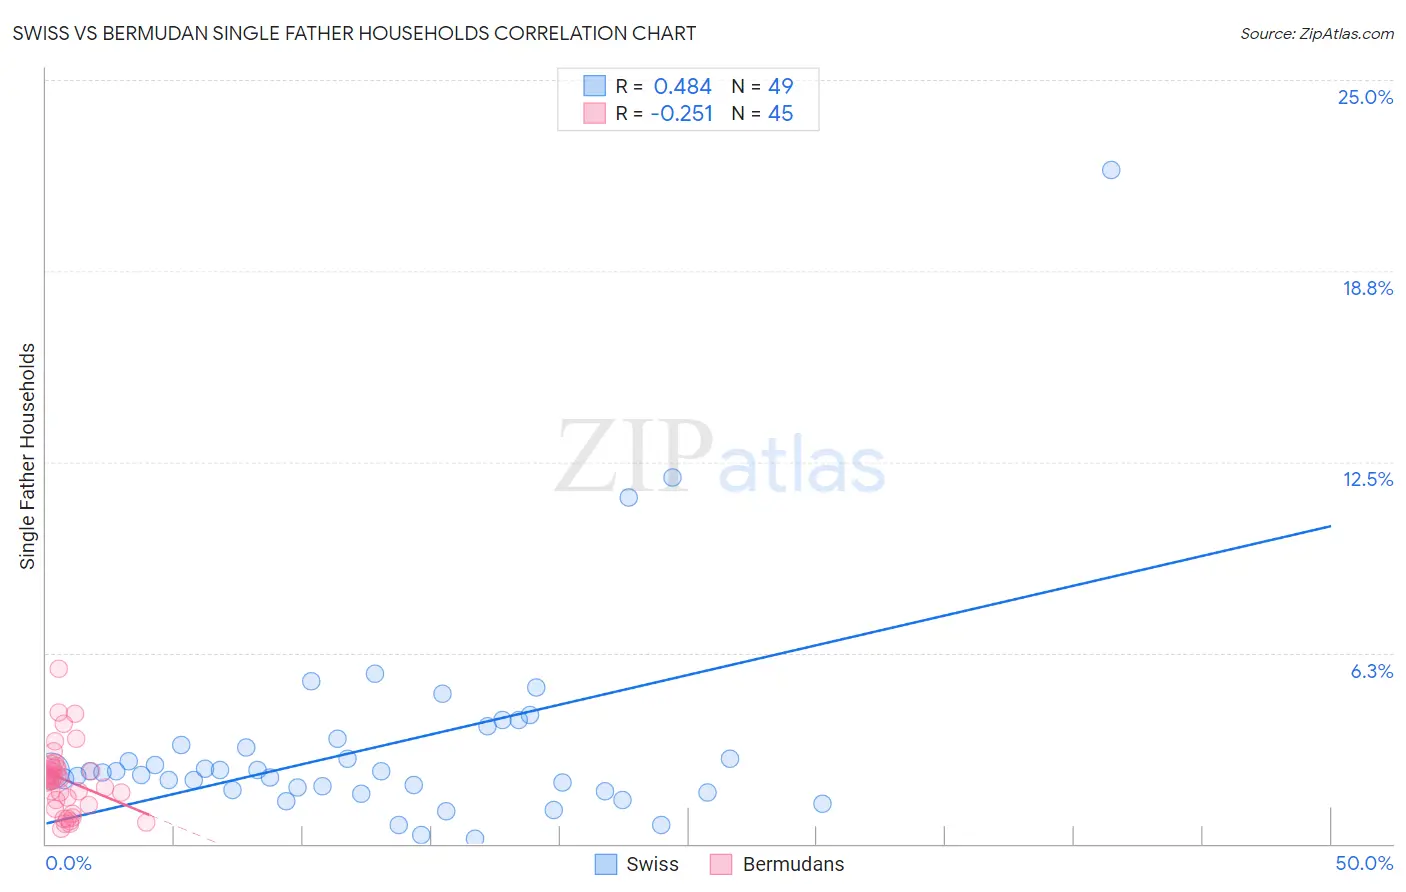
Swiss vs Bermudan Single Father Households Correlation Chart
The statistical analysis conducted on geographies consisting of 458,392,484 people shows a moderate positive correlation between the proportion of Swiss and percentage of single father households in the United States with a correlation coefficient (R) of 0.484 and weighted average of 2.3%. Similarly, the statistical analysis conducted on geographies consisting of 55,647,509 people shows a weak negative correlation between the proportion of Bermudans and percentage of single father households in the United States with a correlation coefficient (R) of -0.251 and weighted average of 2.1%, a difference of 7.8%.
Single Father Households Correlation Summary
| Measurement | Swiss | Bermudan |
| Minimum | 0.16% | 0.51% |
| Maximum | 22.1% | 5.7% |
| Range | 21.9% | 5.2% |
| Mean | 3.2% | 2.1% |
| Median | 2.4% | 2.1% |
| Interquartile 25% (IQ1) | 1.7% | 1.4% |
| Interquartile 75% (IQ3) | 3.3% | 2.5% |
| Interquartile Range (IQR) | 1.6% | 1.1% |
| Standard Deviation (Sample) | 3.5% | 1.1% |
| Standard Deviation (Population) | 3.5% | 1.1% |
Similar Demographics by Single Father Households
Demographics Similar to Swiss by Single Father Households
In terms of single father households, the demographic groups most similar to Swiss are Scottish (2.3%, a difference of 0.030%), Irish (2.3%, a difference of 0.11%), Pakistani (2.3%, a difference of 0.25%), Immigrants from Bolivia (2.3%, a difference of 0.30%), and Scotch-Irish (2.3%, a difference of 0.35%).
| Demographics | Rating | Rank | Single Father Households |
| Bolivians | 81.0 /100 | #154 | Excellent 2.3% |
| Europeans | 80.9 /100 | #155 | Excellent 2.3% |
| Immigrants | South America | 79.9 /100 | #156 | Good 2.3% |
| Canadians | 79.7 /100 | #157 | Good 2.3% |
| Immigrants | Senegal | 79.4 /100 | #158 | Good 2.3% |
| Immigrants | West Indies | 77.9 /100 | #159 | Good 2.3% |
| Immigrants | Bolivia | 76.3 /100 | #160 | Good 2.3% |
| Swiss | 73.2 /100 | #161 | Good 2.3% |
| Scottish | 72.8 /100 | #162 | Good 2.3% |
| Irish | 72.1 /100 | #163 | Good 2.3% |
| Pakistanis | 70.6 /100 | #164 | Good 2.3% |
| Scotch-Irish | 69.4 /100 | #165 | Good 2.3% |
| English | 68.6 /100 | #166 | Good 2.3% |
| South Americans | 64.3 /100 | #167 | Good 2.3% |
| Icelanders | 63.1 /100 | #168 | Good 2.3% |
Demographics Similar to Bermudans by Single Father Households
In terms of single father households, the demographic groups most similar to Bermudans are Arab (2.1%, a difference of 0.14%), Ukrainian (2.1%, a difference of 0.22%), Croatian (2.1%, a difference of 0.23%), Immigrants from Moldova (2.1%, a difference of 0.27%), and Romanian (2.1%, a difference of 0.33%).
| Demographics | Rating | Rank | Single Father Households |
| Bhutanese | 99.5 /100 | #88 | Exceptional 2.1% |
| Immigrants | Armenia | 99.5 /100 | #89 | Exceptional 2.1% |
| Immigrants | Pakistan | 99.5 /100 | #90 | Exceptional 2.1% |
| Immigrants | Guyana | 99.4 /100 | #91 | Exceptional 2.1% |
| Romanians | 99.4 /100 | #92 | Exceptional 2.1% |
| Croatians | 99.3 /100 | #93 | Exceptional 2.1% |
| Ukrainians | 99.3 /100 | #94 | Exceptional 2.1% |
| Bermudans | 99.2 /100 | #95 | Exceptional 2.1% |
| Arabs | 99.2 /100 | #96 | Exceptional 2.1% |
| Immigrants | Moldova | 99.1 /100 | #97 | Exceptional 2.1% |
| Guyanese | 99.1 /100 | #98 | Exceptional 2.1% |
| South Africans | 99.1 /100 | #99 | Exceptional 2.1% |
| Immigrants | Northern Africa | 99.0 /100 | #100 | Exceptional 2.1% |
| Immigrants | Western Europe | 98.9 /100 | #101 | Exceptional 2.1% |
| Argentineans | 98.9 /100 | #102 | Exceptional 2.1% |