Alaska Native vs Bermudan Disability
COMPARE
Alaska Native
Bermudan
Disability
Disability Comparison
Alaska Natives
Bermudans
13.2%
DISABILITY
0.0/ 100
METRIC RATING
298th/ 347
METRIC RANK
12.3%
DISABILITY
1.1/ 100
METRIC RATING
252nd/ 347
METRIC RANK
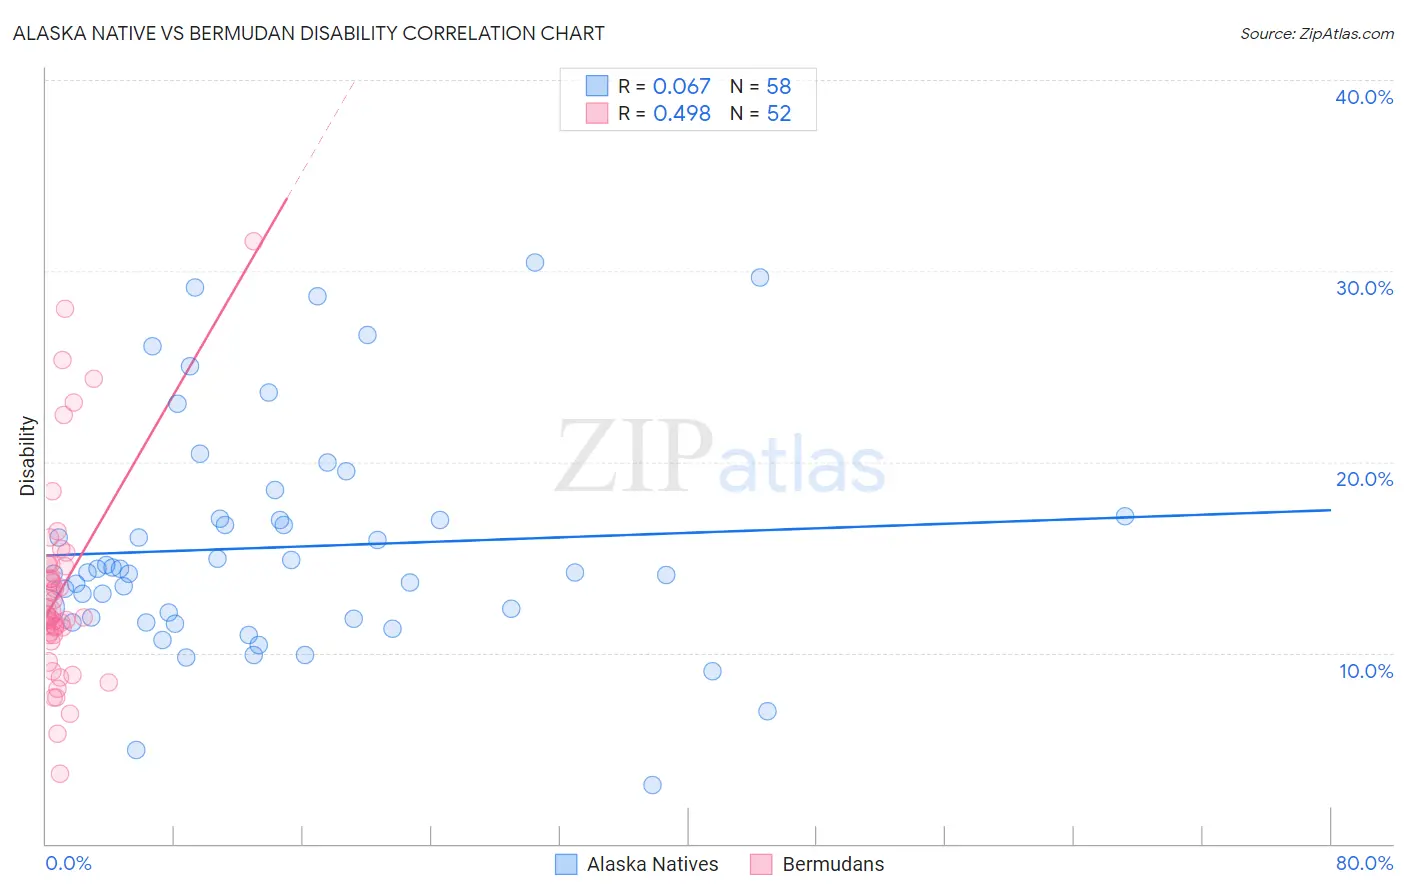
Alaska Native vs Bermudan Disability Correlation Chart
The statistical analysis conducted on geographies consisting of 76,775,228 people shows a slight positive correlation between the proportion of Alaska Natives and percentage of population with a disability in the United States with a correlation coefficient (R) of 0.067 and weighted average of 13.2%. Similarly, the statistical analysis conducted on geographies consisting of 55,721,549 people shows a moderate positive correlation between the proportion of Bermudans and percentage of population with a disability in the United States with a correlation coefficient (R) of 0.498 and weighted average of 12.3%, a difference of 7.2%.
Disability Correlation Summary
| Measurement | Alaska Native | Bermudan |
| Minimum | 3.1% | 3.7% |
| Maximum | 30.4% | 31.6% |
| Range | 27.4% | 27.9% |
| Mean | 15.5% | 13.4% |
| Median | 14.2% | 12.0% |
| Interquartile 25% (IQ1) | 11.8% | 10.9% |
| Interquartile 75% (IQ3) | 17.0% | 14.7% |
| Interquartile Range (IQR) | 5.2% | 3.7% |
| Standard Deviation (Sample) | 6.0% | 5.4% |
| Standard Deviation (Population) | 5.9% | 5.4% |
Similar Demographics by Disability
Demographics Similar to Alaska Natives by Disability
In terms of disability, the demographic groups most similar to Alaska Natives are Hopi (13.2%, a difference of 0.010%), French (13.2%, a difference of 0.020%), Central American Indian (13.2%, a difference of 0.070%), Pennsylvania German (13.2%, a difference of 0.070%), and Nonimmigrants (13.2%, a difference of 0.11%).
| Demographics | Rating | Rank | Disability |
| Yaqui | 0.0 /100 | #291 | Tragic 13.1% |
| Aleuts | 0.0 /100 | #292 | Tragic 13.1% |
| Marshallese | 0.0 /100 | #293 | Tragic 13.1% |
| Celtics | 0.0 /100 | #294 | Tragic 13.1% |
| Immigrants | Nonimmigrants | 0.0 /100 | #295 | Tragic 13.2% |
| Central American Indians | 0.0 /100 | #296 | Tragic 13.2% |
| Hopi | 0.0 /100 | #297 | Tragic 13.2% |
| Alaska Natives | 0.0 /100 | #298 | Tragic 13.2% |
| French | 0.0 /100 | #299 | Tragic 13.2% |
| Pennsylvania Germans | 0.0 /100 | #300 | Tragic 13.2% |
| Immigrants | Micronesia | 0.0 /100 | #301 | Tragic 13.2% |
| Arapaho | 0.0 /100 | #302 | Tragic 13.2% |
| Scotch-Irish | 0.0 /100 | #303 | Tragic 13.3% |
| Yakama | 0.0 /100 | #304 | Tragic 13.4% |
| French Canadians | 0.0 /100 | #305 | Tragic 13.4% |
Demographics Similar to Bermudans by Disability
In terms of disability, the demographic groups most similar to Bermudans are Subsaharan African (12.3%, a difference of 0.19%), European (12.3%, a difference of 0.19%), Carpatho Rusyn (12.3%, a difference of 0.20%), Guamanian/Chamorro (12.3%, a difference of 0.21%), and Indonesian (12.2%, a difference of 0.25%).
| Demographics | Rating | Rank | Disability |
| Liberians | 1.5 /100 | #245 | Tragic 12.2% |
| Swiss | 1.5 /100 | #246 | Tragic 12.2% |
| Indonesians | 1.4 /100 | #247 | Tragic 12.2% |
| Guamanians/Chamorros | 1.4 /100 | #248 | Tragic 12.3% |
| Carpatho Rusyns | 1.4 /100 | #249 | Tragic 12.3% |
| Sub-Saharan Africans | 1.4 /100 | #250 | Tragic 12.3% |
| Europeans | 1.4 /100 | #251 | Tragic 12.3% |
| Bermudans | 1.1 /100 | #252 | Tragic 12.3% |
| Belgians | 0.8 /100 | #253 | Tragic 12.3% |
| German Russians | 0.8 /100 | #254 | Tragic 12.3% |
| Slovenes | 0.6 /100 | #255 | Tragic 12.4% |
| Immigrants | Dominica | 0.6 /100 | #256 | Tragic 12.4% |
| Immigrants | Laos | 0.5 /100 | #257 | Tragic 12.4% |
| Slavs | 0.5 /100 | #258 | Tragic 12.4% |
| Canadians | 0.4 /100 | #259 | Tragic 12.4% |