Slavic vs Northern European Disability Age 65 to 74
COMPARE
Slavic
Northern European
Disability Age 65 to 74
Disability Age 65 to 74 Comparison
Slavs
Northern Europeans
23.0%
DISABILITY AGE 65 TO 74
75.2/ 100
METRIC RATING
153rd/ 347
METRIC RANK
22.6%
DISABILITY AGE 65 TO 74
88.9/ 100
METRIC RATING
133rd/ 347
METRIC RANK
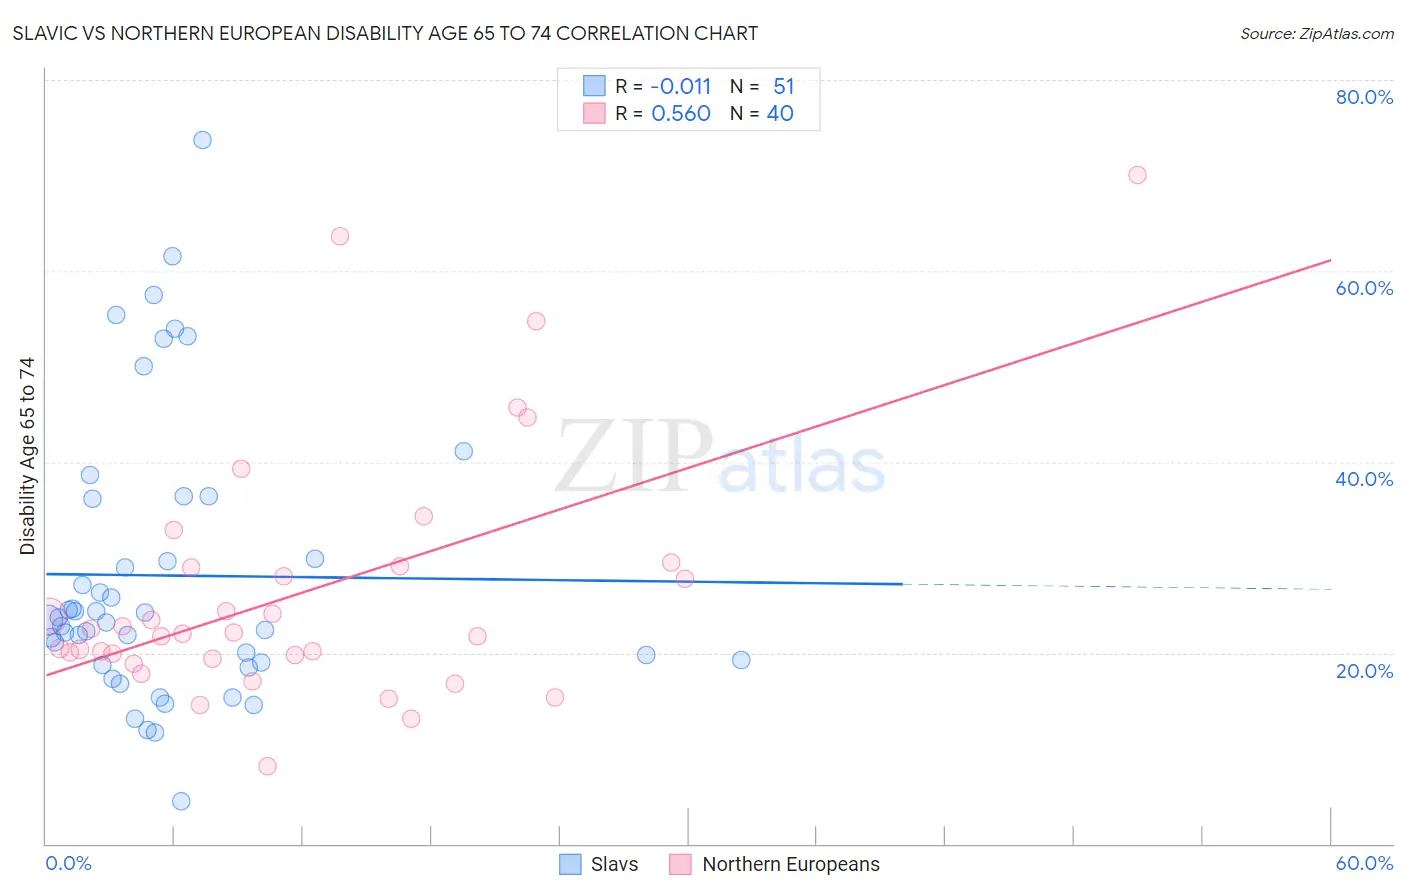
Slavic vs Northern European Disability Age 65 to 74 Correlation Chart
The statistical analysis conducted on geographies consisting of 270,690,896 people shows no correlation between the proportion of Slavs and percentage of population with a disability between the ages 65 and 75 in the United States with a correlation coefficient (R) of -0.011 and weighted average of 23.0%. Similarly, the statistical analysis conducted on geographies consisting of 405,506,893 people shows a substantial positive correlation between the proportion of Northern Europeans and percentage of population with a disability between the ages 65 and 75 in the United States with a correlation coefficient (R) of 0.560 and weighted average of 22.6%, a difference of 1.5%.
Disability Age 65 to 74 Correlation Summary
| Measurement | Slavic | Northern European |
| Minimum | 4.4% | 8.1% |
| Maximum | 73.7% | 70.0% |
| Range | 69.2% | 61.9% |
| Mean | 28.1% | 26.3% |
| Median | 23.4% | 22.0% |
| Interquartile 25% (IQ1) | 19.0% | 19.6% |
| Interquartile 75% (IQ3) | 36.1% | 29.0% |
| Interquartile Range (IQR) | 17.1% | 9.4% |
| Standard Deviation (Sample) | 14.7% | 13.2% |
| Standard Deviation (Population) | 14.6% | 13.0% |
Demographics Similar to Slavs and Northern Europeans by Disability Age 65 to 74
In terms of disability age 65 to 74, the demographic groups most similar to Slavs are Finnish (22.9%, a difference of 0.11%), Canadian (22.9%, a difference of 0.20%), Immigrants from Morocco (22.9%, a difference of 0.20%), Swiss (22.9%, a difference of 0.38%), and New Zealander (22.9%, a difference of 0.40%). Similarly, the demographic groups most similar to Northern Europeans are Afghan (22.6%, a difference of 0.050%), Immigrants from Ukraine (22.6%, a difference of 0.080%), Ethiopian (22.7%, a difference of 0.15%), Taiwanese (22.7%, a difference of 0.19%), and Immigrants from Moldova (22.7%, a difference of 0.24%).
| Demographics | Rating | Rank | Disability Age 65 to 74 |
| Northern Europeans | 88.9 /100 | #133 | Excellent 22.6% |
| Afghans | 88.6 /100 | #134 | Excellent 22.6% |
| Immigrants | Ukraine | 88.4 /100 | #135 | Excellent 22.6% |
| Ethiopians | 87.9 /100 | #136 | Excellent 22.7% |
| Taiwanese | 87.6 /100 | #137 | Excellent 22.7% |
| Immigrants | Moldova | 87.3 /100 | #138 | Excellent 22.7% |
| Immigrants | Syria | 85.8 /100 | #139 | Excellent 22.7% |
| Ugandans | 85.4 /100 | #140 | Excellent 22.7% |
| Belgians | 85.3 /100 | #141 | Excellent 22.7% |
| Immigrants | Ethiopia | 85.3 /100 | #142 | Excellent 22.7% |
| Arabs | 84.8 /100 | #143 | Excellent 22.8% |
| Danes | 84.4 /100 | #144 | Excellent 22.8% |
| Immigrants | Uganda | 84.0 /100 | #145 | Excellent 22.8% |
| Alsatians | 83.7 /100 | #146 | Excellent 22.8% |
| Immigrants | Uzbekistan | 83.1 /100 | #147 | Excellent 22.8% |
| New Zealanders | 79.9 /100 | #148 | Good 22.9% |
| Swiss | 79.7 /100 | #149 | Good 22.9% |
| Canadians | 77.7 /100 | #150 | Good 22.9% |
| Immigrants | Morocco | 77.6 /100 | #151 | Good 22.9% |
| Finns | 76.5 /100 | #152 | Good 22.9% |
| Slavs | 75.2 /100 | #153 | Good 23.0% |