Subsaharan African vs Nicaraguan Householder Income Under 25 years

COMPARE

Subsaharan African
Race
Ancestry
AfghanAfricanAlaska NativeAlaskan AthabascanAlbanianAleutAlsatianAmericanApacheArabArapahoArgentineanArmenianAssyrian/Chaldean/SyriacAustralianAustrianBahamianBangladeshiBarbadianBasqueBelgianBelizeanBermudanBhutaneseBlackfeetBolivianBrazilianBritishBritish West IndianBulgarianBurmeseCajunCambodianCanadianCape VerdeanCarpatho RusynCelticCentral AmericanCentral American IndianCherokeeCheyenneChickasawChileanChineseChippewaChoctawColombianColvilleComancheCosta RicanCreeCreekCroatianCrowCubanCypriotCzechCzechoslovakianDanishDelawareDominicanDutchDutch West IndianEastern EuropeanEcuadorianEgyptianEnglishEstonianEthiopianEuropeanFijianFilipinoFinnishFrenchFrench American IndianFrench CanadianGermanGerman RussianGhanaianGreekGuamanian/ChamorroGuatemalanGuyaneseHaitianHmongHonduranHopiHoumaHungarianIcelanderIndian (Asian)IndonesianInupiatIranianIraqiIrishIroquoisIsraeliItalianJamaicanJapaneseJordanianKenyanKiowaKoreanLaotianLatvianLebaneseLiberianLithuanianLumbeeLuxembourgerMacedonianMalaysianMalteseMarshalleseMenomineeMexicanMexican American IndianMongolianMoroccanNative HawaiianNavajoNepaleseNew ZealanderNigerianNorthern EuropeanNorwegianOkinawanOsageOttawaPaiutePakistaniPalestinianPanamanianParaguayanPennsylvania GermanPeruvianPimaPolishPortuguesePotawatomiPuebloPuerto RicanPuget Sound SalishRomanianRussianSalvadoranSamoanScandinavianScotch-IrishScottishSeminoleSenegaleseSerbianShoshoneSierra LeoneanSiouxSlavicSlovakSloveneSomaliSouth AfricanSouth AmericanSouth American IndianSoviet UnionSpaniardSpanishSpanish AmericanSpanish American IndianSri LankanSubsaharan AfricanSudaneseSwedishSwissSyrianTaiwaneseThaiTlingit-HaidaTohono O'OdhamTonganTrinidadian and TobagonianTsimshianTurkishU.S. Virgin IslanderUgandanUkrainianUruguayanUteVenezuelanVietnameseWelshWest IndianYakamaYaquiYugoslavianYumanYup'ikZimbabwean
Immigration
NonimmigrantsImmigrantsAfghanistanAfricaAlbaniaArgentinaArmeniaAsiaAustraliaAustriaBahamasBangladeshBarbadosBelarusBelgiumBelizeBoliviaBosnia and HerzegovinaBrazilBulgariaBurma/MyanmarCabo VerdeCambodiaCameroonCanadaCaribbeanCentral AmericaChileChinaColombiaCongoCosta RicaCroatiaCubaCzechoslovakiaDenmarkDominicaDominican RepublicEastern AfricaEastern AsiaEastern EuropeEcuadorEgyptEl SalvadorEnglandEritreaEthiopiaEuropeFijiFranceGermanyGhanaGreeceGrenadaGuatemalaGuyanaHaitiHondurasHong KongHungaryIndiaIndonesiaIranIraqIrelandIsraelItalyJamaicaJapanJordanKazakhstanKenyaKoreaKuwaitLaosLatin AmericaLatviaLebanonLiberiaLithuaniaMalaysiaMexicoMicronesiaMiddle AfricaMoldovaMoroccoNepalNetherlandsNicaraguaNigeriaNorth AmericaNorth MacedoniaNorthern AfricaNorthern EuropeNorwayOceaniaPakistanPanamaPeruPhilippinesPolandPortugalRomaniaRussiaSaudi ArabiaScotlandSenegalSerbiaSierra LeoneSingaporeSomaliaSouth AfricaSouth AmericaSouth Central AsiaSouth Eastern AsiaSouthern EuropeSpainSri LankaSt. Vincent and the GrenadinesSudanSwedenSwitzerlandSyriaTaiwanThailandTrinidad and TobagoTurkeyUgandaUkraineUruguayUzbekistanVenezuelaVietnamWest IndiesWestern AfricaWestern AsiaWestern EuropeYemenZaireZimbabweAzores
Nicaraguan
Race
Ancestry
AfghanAfricanAlaska NativeAlaskan AthabascanAlbanianAleutAlsatianAmericanApacheArabArapahoArgentineanArmenianAssyrian/Chaldean/SyriacAustralianAustrianBahamianBangladeshiBarbadianBasqueBelgianBelizeanBermudanBhutaneseBlackfeetBolivianBrazilianBritishBritish West IndianBulgarianBurmeseCajunCambodianCanadianCape VerdeanCarpatho RusynCelticCentral AmericanCentral American IndianCherokeeCheyenneChickasawChileanChineseChippewaChoctawColombianColvilleComancheCosta RicanCreeCreekCroatianCrowCubanCypriotCzechCzechoslovakianDanishDelawareDominicanDutchDutch West IndianEastern EuropeanEcuadorianEgyptianEnglishEstonianEthiopianEuropeanFijianFilipinoFinnishFrenchFrench American IndianFrench CanadianGermanGerman RussianGhanaianGreekGuamanian/ChamorroGuatemalanGuyaneseHaitianHmongHonduranHopiHoumaHungarianIcelanderIndian (Asian)IndonesianInupiatIranianIraqiIrishIroquoisIsraeliItalianJamaicanJapaneseJordanianKenyanKiowaKoreanLaotianLatvianLebaneseLiberianLithuanianLumbeeLuxembourgerMacedonianMalaysianMalteseMarshalleseMenomineeMexicanMexican American IndianMongolianMoroccanNative HawaiianNavajoNepaleseNew ZealanderNicaraguanNigerianNorthern EuropeanNorwegianOkinawanOsageOttawaPaiutePakistaniPalestinianPanamanianParaguayanPennsylvania GermanPeruvianPimaPolishPortuguesePotawatomiPuebloPuerto RicanPuget Sound SalishRomanianRussianSalvadoranSamoanScandinavianScotch-IrishScottishSeminoleSenegaleseSerbianShoshoneSierra LeoneanSiouxSlavicSlovakSloveneSomaliSouth AfricanSouth AmericanSouth American IndianSoviet UnionSpaniardSpanishSpanish AmericanSpanish American IndianSri LankanSudaneseSwedishSwissSyrianTaiwaneseThaiTlingit-HaidaTohono O'OdhamTonganTrinidadian and TobagonianTsimshianTurkishU.S. Virgin IslanderUgandanUkrainianUruguayanUteVenezuelanVietnameseWelshWest IndianYakamaYaquiYugoslavianYumanYup'ikZimbabwean
Immigration
NonimmigrantsImmigrantsAfghanistanAfricaAlbaniaArgentinaArmeniaAsiaAustraliaAustriaBahamasBangladeshBarbadosBelarusBelgiumBelizeBoliviaBosnia and HerzegovinaBrazilBulgariaBurma/MyanmarCabo VerdeCambodiaCameroonCanadaCaribbeanCentral AmericaChileChinaColombiaCongoCosta RicaCroatiaCubaCzechoslovakiaDenmarkDominicaDominican RepublicEastern AfricaEastern AsiaEastern EuropeEcuadorEgyptEl SalvadorEnglandEritreaEthiopiaEuropeFijiFranceGermanyGhanaGreeceGrenadaGuatemalaGuyanaHaitiHondurasHong KongHungaryIndiaIndonesiaIranIraqIrelandIsraelItalyJamaicaJapanJordanKazakhstanKenyaKoreaKuwaitLaosLatin AmericaLatviaLebanonLiberiaLithuaniaMalaysiaMexicoMicronesiaMiddle AfricaMoldovaMoroccoNepalNetherlandsNicaraguaNigeriaNorth AmericaNorth MacedoniaNorthern AfricaNorthern EuropeNorwayOceaniaPakistanPanamaPeruPhilippinesPolandPortugalRomaniaRussiaSaudi ArabiaScotlandSenegalSerbiaSierra LeoneSingaporeSomaliaSouth AfricaSouth AmericaSouth Central AsiaSouth Eastern AsiaSouthern EuropeSpainSri LankaSt. Vincent and the GrenadinesSudanSwedenSwitzerlandSyriaTaiwanThailandTrinidad and TobagoTurkeyUgandaUkraineUruguayUzbekistanVenezuelaVietnamWest IndiesWestern AfricaWestern AsiaWestern EuropeYemenZaireZimbabweAzores
Householder Income Under 25 years
Income
Poverty
Unemployment
Labor Participation
Family Structure
Vehicle Availability
Education Level
Disability

Householder Income Under 25 years Comparison

Sub-Saharan Africans

Nicaraguans

Tragic
Exceptional
$48,691
HOUSEHOLDER INCOME UNDER 25 YEARS
0.0/ 100
METRIC RATING
293rd/ 347
METRIC RANK
$53,275
HOUSEHOLDER INCOME UNDER 25 YEARS
93.4/ 100
METRIC RATING
130th/ 347
METRIC RANK

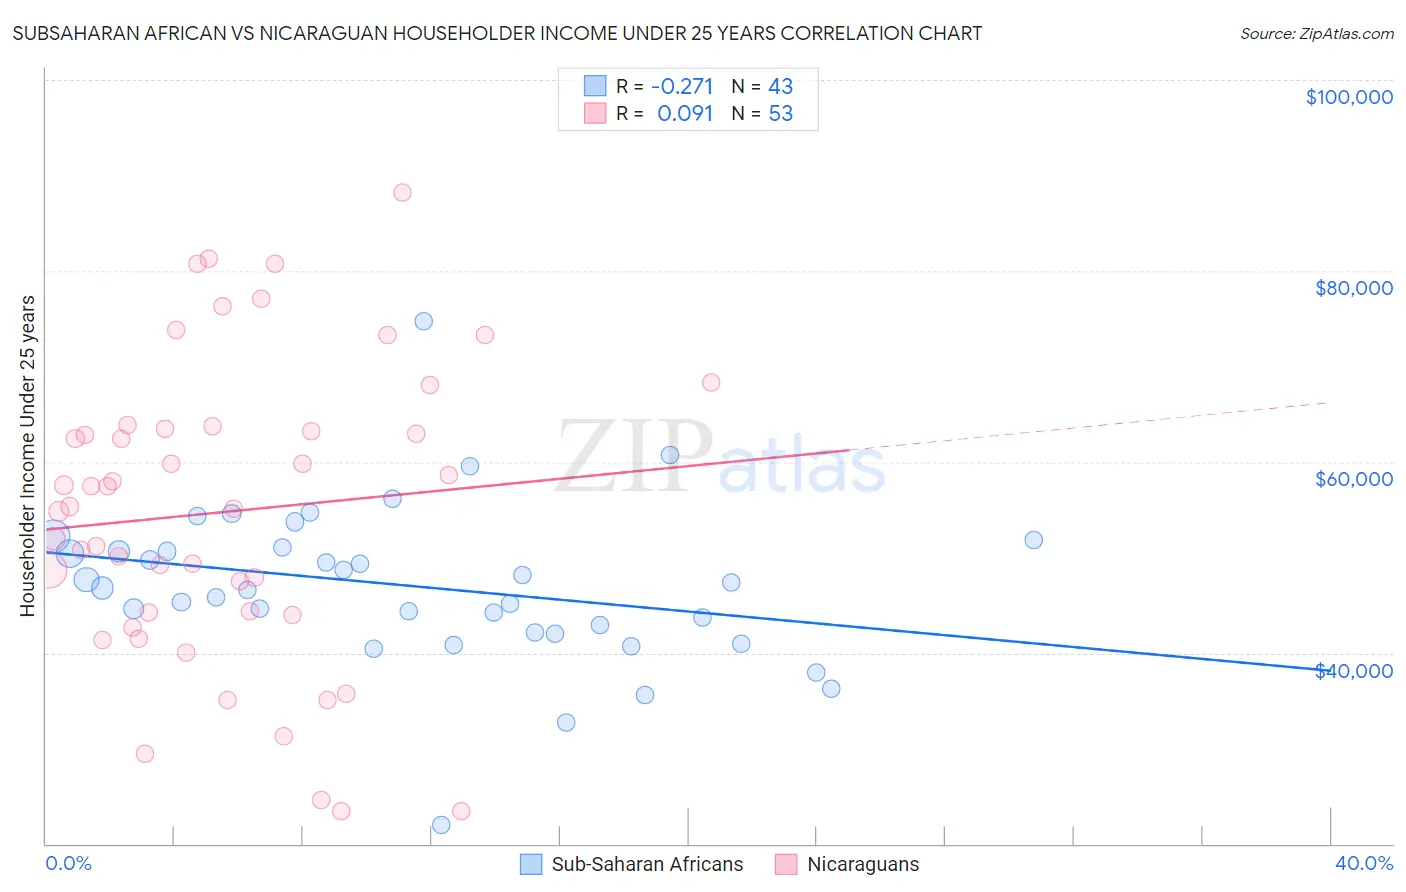
Subsaharan African vs Nicaraguan Householder Income Under 25 years Correlation Chart

The statistical analysis conducted on geographies consisting of 413,616,575 people shows a weak negative correlation between the proportion of Sub-Saharan Africans and household income with householder under the age of 25 in the United States with a correlation coefficient (R) of -0.271 and weighted average of $48,691. Similarly, the statistical analysis conducted on geographies consisting of 251,521,022 people shows a slight positive correlation between the proportion of Nicaraguans and household income with householder under the age of 25 in the United States with a correlation coefficient (R) of 0.091 and weighted average of $53,275, a difference of 9.4%.
Subsaharan African vs Nicaraguan Householder Income Under 25 years

Householder Income Under 25 years Correlation Summary

MeasurementSubsaharan AfricanNicaraguan
Minimum$21,932$23,354
Maximum$74,779$88,274
Range$52,847$64,920
Mean$46,996$54,761
Median$46,794$55,328
Interquartile 25% (IQ1)$42,165$44,098
Interquartile 75% (IQ3)$51,035$63,651
Interquartile Range (IQR)$8,871$19,552
Standard Deviation (Sample)$8,415$15,647
Standard Deviation (Population)$8,316$15,499

Similar Demographics by Householder Income Under 25 years

Demographics Similar to Sub-Saharan Africans by Householder Income Under 25 years

In terms of householder income under 25 years, the demographic groups most similar to Sub-Saharan Africans are Shoshone ($48,720, a difference of 0.060%), Somali ($48,657, a difference of 0.070%), Central American Indian ($48,643, a difference of 0.10%), Immigrants from Burma/Myanmar ($48,749, a difference of 0.12%), and Blackfeet ($48,603, a difference of 0.18%).
DemographicsRating | RankHouseholder Income Under 25 years
French American Indians
0.0
/100
|
#286
Tragic
$48,977
Senegalese
0.0
/100
|
#287
Tragic
$48,953
Liberians
0.0
/100
|
#288
Tragic
$48,917
Hondurans
0.0
/100
|
#289
Tragic
$48,885
Americans
0.0
/100
|
#290
Tragic
$48,860
Immigrants | Burma/Myanmar
0.0
/100
|
#291
Tragic
$48,749
Shoshone
0.0
/100
|
#292
Tragic
$48,720
Sub-Saharan Africans
0.0
/100
|
#293
Tragic
$48,691
Somalis
0.0
/100
|
#294
Tragic
$48,657
Central American Indians
0.0
/100
|
#295
Tragic
$48,643
Blackfeet
0.0
/100
|
#296
Tragic
$48,603
Cree
0.0
/100
|
#297
Tragic
$48,514
Yaqui
0.0
/100
|
#298
Tragic
$48,300
Immigrants | Honduras
0.0
/100
|
#299
Tragic
$48,267
Immigrants | Somalia
0.0
/100
|
#300
Tragic
$48,135

Demographics Similar to Nicaraguans by Householder Income Under 25 years

In terms of householder income under 25 years, the demographic groups most similar to Nicaraguans are Immigrants from Nicaragua ($53,266, a difference of 0.020%), Moroccan ($53,256, a difference of 0.030%), New Zealander ($53,294, a difference of 0.040%), Immigrants from North America ($53,307, a difference of 0.060%), and Immigrants from Bulgaria ($53,305, a difference of 0.060%).
DemographicsRating | RankHouseholder Income Under 25 years
Immigrants | Iraq
94.9
/100
|
#123
Exceptional
$53,384
Colombians
94.6
/100
|
#124
Exceptional
$53,357
Pakistanis
94.1
/100
|
#125
Exceptional
$53,325
Immigrants | Serbia
94.1
/100
|
#126
Exceptional
$53,321
Immigrants | North America
93.9
/100
|
#127
Exceptional
$53,307
Immigrants | Bulgaria
93.9
/100
|
#128
Exceptional
$53,305
New Zealanders
93.7
/100
|
#129
Exceptional
$53,294
Nicaraguans
93.4
/100
|
#130
Exceptional
$53,275
Immigrants | Nicaragua
93.3
/100
|
#131
Exceptional
$53,266
Moroccans
93.1
/100
|
#132
Exceptional
$53,256
Immigrants | Immigrants
92.2
/100
|
#133
Exceptional
$53,201
Immigrants | Northern Africa
91.9
/100
|
#134
Exceptional
$53,185
Chileans
91.9
/100
|
#135
Exceptional
$53,185
Armenians
91.8
/100
|
#136
Exceptional
$53,179
Immigrants | Barbados
91.5
/100
|
#137
Exceptional
$53,163