Marshallese vs Immigrants from Vietnam Disability Age 5 to 17
COMPARE
Marshallese
Immigrants from Vietnam
Disability Age 5 to 17
Disability Age 5 to 17 Comparison
Marshallese
Immigrants from Vietnam
5.7%
DISABILITY AGE 5 TO 17
28.1/ 100
METRIC RATING
188th/ 347
METRIC RANK
5.2%
DISABILITY AGE 5 TO 17
99.7/ 100
METRIC RATING
72nd/ 347
METRIC RANK
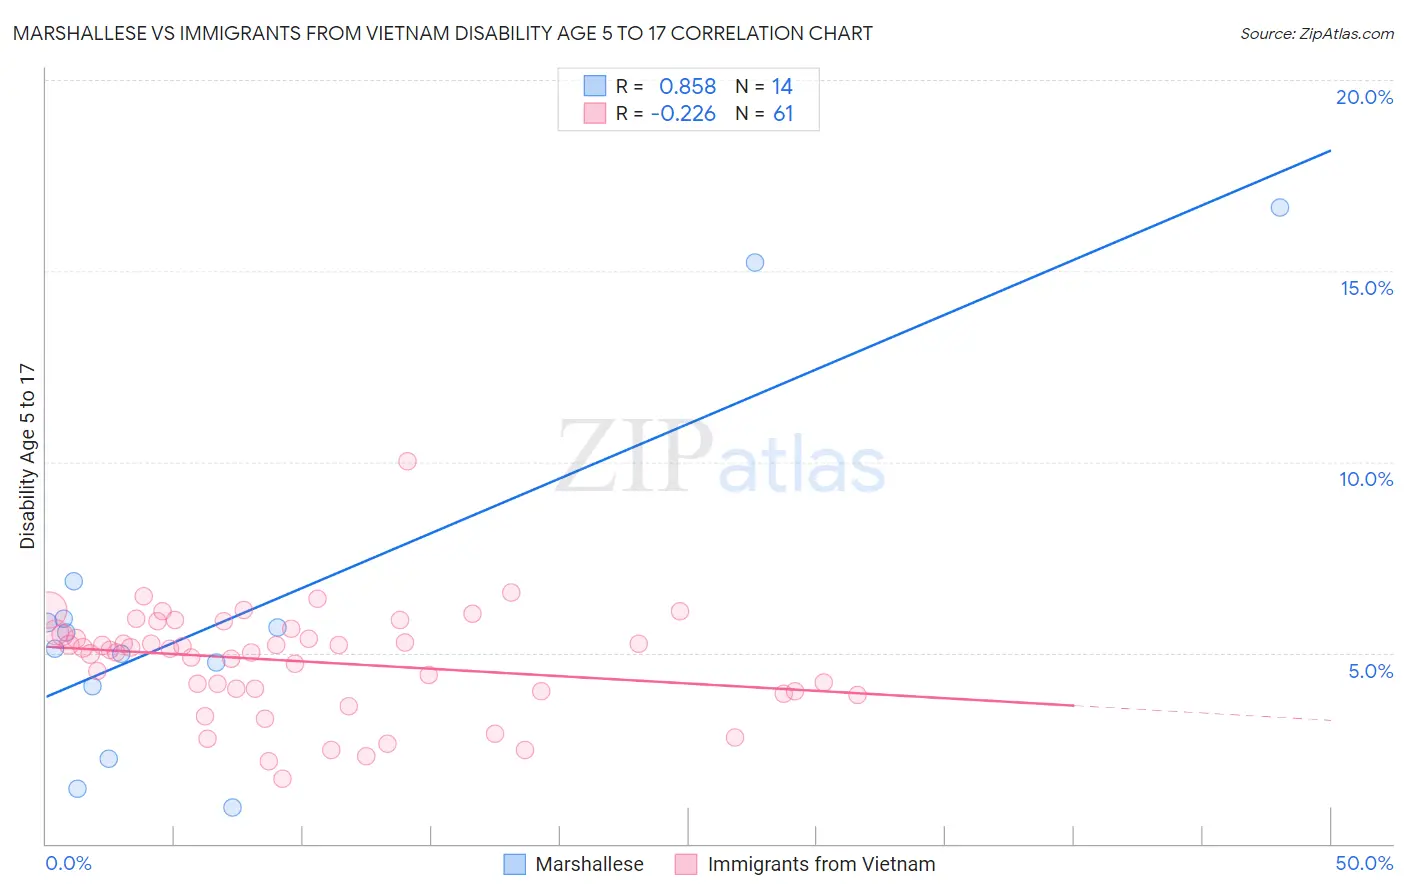
Marshallese vs Immigrants from Vietnam Disability Age 5 to 17 Correlation Chart
The statistical analysis conducted on geographies consisting of 14,753,220 people shows a very strong positive correlation between the proportion of Marshallese and percentage of population with a disability between the ages 5 and 17 in the United States with a correlation coefficient (R) of 0.858 and weighted average of 5.7%. Similarly, the statistical analysis conducted on geographies consisting of 402,102,659 people shows a weak negative correlation between the proportion of Immigrants from Vietnam and percentage of population with a disability between the ages 5 and 17 in the United States with a correlation coefficient (R) of -0.226 and weighted average of 5.2%, a difference of 8.9%.
Disability Age 5 to 17 Correlation Summary
| Measurement | Marshallese | Immigrants from Vietnam |
| Minimum | 0.94% | 1.7% |
| Maximum | 16.7% | 10.0% |
| Range | 15.7% | 8.3% |
| Mean | 6.1% | 4.8% |
| Median | 5.3% | 5.1% |
| Interquartile 25% (IQ1) | 4.1% | 4.0% |
| Interquartile 75% (IQ3) | 5.9% | 5.6% |
| Interquartile Range (IQR) | 1.8% | 1.6% |
| Standard Deviation (Sample) | 4.5% | 1.4% |
| Standard Deviation (Population) | 4.4% | 1.4% |
Similar Demographics by Disability Age 5 to 17
Demographics Similar to Marshallese by Disability Age 5 to 17
In terms of disability age 5 to 17, the demographic groups most similar to Marshallese are Pueblo (5.7%, a difference of 0.040%), Immigrants from Eastern Africa (5.7%, a difference of 0.050%), Danish (5.7%, a difference of 0.10%), Immigrants from Bosnia and Herzegovina (5.7%, a difference of 0.11%), and Immigrants from Thailand (5.7%, a difference of 0.12%).
| Demographics | Rating | Rank | Disability Age 5 to 17 |
| Immigrants | England | 36.4 /100 | #181 | Fair 5.6% |
| Mexican American Indians | 35.2 /100 | #182 | Fair 5.6% |
| Immigrants | Latin America | 34.3 /100 | #183 | Fair 5.6% |
| Syrians | 33.8 /100 | #184 | Fair 5.6% |
| Immigrants | Mexico | 33.7 /100 | #185 | Fair 5.6% |
| Fijians | 31.7 /100 | #186 | Fair 5.7% |
| Immigrants | Thailand | 30.2 /100 | #187 | Fair 5.7% |
| Marshallese | 28.1 /100 | #188 | Fair 5.7% |
| Pueblo | 27.5 /100 | #189 | Fair 5.7% |
| Immigrants | Eastern Africa | 27.3 /100 | #190 | Fair 5.7% |
| Danes | 26.5 /100 | #191 | Fair 5.7% |
| Immigrants | Bosnia and Herzegovina | 26.3 /100 | #192 | Fair 5.7% |
| Immigrants | Canada | 26.1 /100 | #193 | Fair 5.7% |
| Croatians | 23.6 /100 | #194 | Fair 5.7% |
| Immigrants | Nigeria | 23.4 /100 | #195 | Fair 5.7% |
Demographics Similar to Immigrants from Vietnam by Disability Age 5 to 17
In terms of disability age 5 to 17, the demographic groups most similar to Immigrants from Vietnam are Jordanian (5.2%, a difference of 0.020%), Immigrants from Czechoslovakia (5.2%, a difference of 0.020%), Immigrants from Belgium (5.2%, a difference of 0.070%), Immigrants from Romania (5.2%, a difference of 0.090%), and Guyanese (5.2%, a difference of 0.11%).
| Demographics | Rating | Rank | Disability Age 5 to 17 |
| Immigrants | Greece | 99.8 /100 | #65 | Exceptional 5.2% |
| Palestinians | 99.8 /100 | #66 | Exceptional 5.2% |
| Macedonians | 99.8 /100 | #67 | Exceptional 5.2% |
| Immigrants | Syria | 99.7 /100 | #68 | Exceptional 5.2% |
| Guyanese | 99.7 /100 | #69 | Exceptional 5.2% |
| Immigrants | Belgium | 99.7 /100 | #70 | Exceptional 5.2% |
| Jordanians | 99.7 /100 | #71 | Exceptional 5.2% |
| Immigrants | Vietnam | 99.7 /100 | #72 | Exceptional 5.2% |
| Immigrants | Czechoslovakia | 99.7 /100 | #73 | Exceptional 5.2% |
| Immigrants | Romania | 99.7 /100 | #74 | Exceptional 5.2% |
| Immigrants | Moldova | 99.6 /100 | #75 | Exceptional 5.2% |
| Immigrants | Guyana | 99.6 /100 | #76 | Exceptional 5.2% |
| Immigrants | Kazakhstan | 99.6 /100 | #77 | Exceptional 5.2% |
| Immigrants | Cuba | 99.6 /100 | #78 | Exceptional 5.2% |
| Afghans | 99.6 /100 | #79 | Exceptional 5.2% |