Sioux vs Shoshone Disability
COMPARE
Sioux
Shoshone
Disability
Disability Comparison
Sioux
Shoshone
12.8%
DISABILITY
0.0/ 100
METRIC RATING
275th/ 347
METRIC RANK
13.5%
DISABILITY
0.0/ 100
METRIC RATING
307th/ 347
METRIC RANK
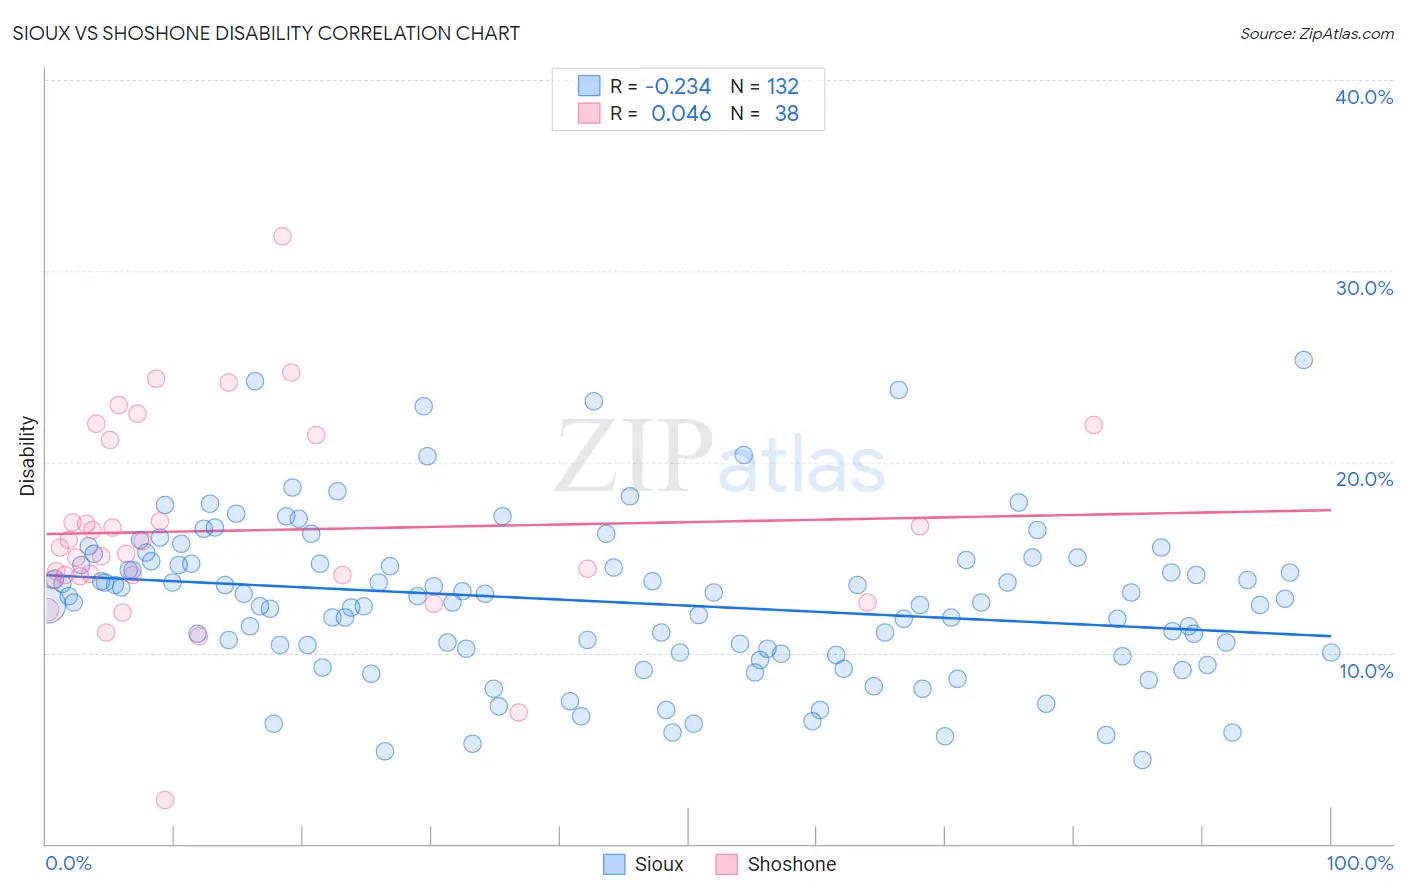
Sioux vs Shoshone Disability Correlation Chart
The statistical analysis conducted on geographies consisting of 234,155,753 people shows a weak negative correlation between the proportion of Sioux and percentage of population with a disability in the United States with a correlation coefficient (R) of -0.234 and weighted average of 12.8%. Similarly, the statistical analysis conducted on geographies consisting of 66,619,944 people shows no correlation between the proportion of Shoshone and percentage of population with a disability in the United States with a correlation coefficient (R) of 0.046 and weighted average of 13.5%, a difference of 5.8%.
Disability Correlation Summary
| Measurement | Sioux | Shoshone |
| Minimum | 4.4% | 2.3% |
| Maximum | 25.4% | 31.8% |
| Range | 21.0% | 29.5% |
| Mean | 12.7% | 16.4% |
| Median | 12.7% | 15.3% |
| Interquartile 25% (IQ1) | 10.0% | 14.0% |
| Interquartile 75% (IQ3) | 14.8% | 21.2% |
| Interquartile Range (IQR) | 4.7% | 7.1% |
| Standard Deviation (Sample) | 4.1% | 5.4% |
| Standard Deviation (Population) | 4.1% | 5.3% |
Similar Demographics by Disability
Demographics Similar to Sioux by Disability
In terms of disability, the demographic groups most similar to Sioux are Nepalese (12.8%, a difference of 0.080%), Hmong (12.8%, a difference of 0.15%), Dutch (12.8%, a difference of 0.20%), German (12.8%, a difference of 0.37%), and Fijian (12.8%, a difference of 0.46%).
| Demographics | Rating | Rank | Disability |
| Bangladeshis | 0.1 /100 | #268 | Tragic 12.6% |
| Immigrants | Dominican Republic | 0.1 /100 | #269 | Tragic 12.6% |
| Portuguese | 0.1 /100 | #270 | Tragic 12.6% |
| Immigrants | Yemen | 0.1 /100 | #271 | Tragic 12.6% |
| Dominicans | 0.0 /100 | #272 | Tragic 12.7% |
| Finns | 0.0 /100 | #273 | Tragic 12.7% |
| Nepalese | 0.0 /100 | #274 | Tragic 12.8% |
| Sioux | 0.0 /100 | #275 | Tragic 12.8% |
| Hmong | 0.0 /100 | #276 | Tragic 12.8% |
| Dutch | 0.0 /100 | #277 | Tragic 12.8% |
| Germans | 0.0 /100 | #278 | Tragic 12.8% |
| Fijians | 0.0 /100 | #279 | Tragic 12.8% |
| Spanish | 0.0 /100 | #280 | Tragic 12.8% |
| Immigrants | Portugal | 0.0 /100 | #281 | Tragic 12.9% |
| Scottish | 0.0 /100 | #282 | Tragic 12.9% |
Demographics Similar to Shoshone by Disability
In terms of disability, the demographic groups most similar to Shoshone are Cape Verdean (13.5%, a difference of 0.050%), French American Indian (13.5%, a difference of 0.090%), Tlingit-Haida (13.5%, a difference of 0.18%), French Canadian (13.4%, a difference of 0.66%), and Blackfeet (13.6%, a difference of 0.71%).
| Demographics | Rating | Rank | Disability |
| Pennsylvania Germans | 0.0 /100 | #300 | Tragic 13.2% |
| Immigrants | Micronesia | 0.0 /100 | #301 | Tragic 13.2% |
| Arapaho | 0.0 /100 | #302 | Tragic 13.2% |
| Scotch-Irish | 0.0 /100 | #303 | Tragic 13.3% |
| Yakama | 0.0 /100 | #304 | Tragic 13.4% |
| French Canadians | 0.0 /100 | #305 | Tragic 13.4% |
| Cape Verdeans | 0.0 /100 | #306 | Tragic 13.5% |
| Shoshone | 0.0 /100 | #307 | Tragic 13.5% |
| French American Indians | 0.0 /100 | #308 | Tragic 13.5% |
| Tlingit-Haida | 0.0 /100 | #309 | Tragic 13.5% |
| Blackfeet | 0.0 /100 | #310 | Tragic 13.6% |
| Delaware | 0.0 /100 | #311 | Tragic 13.6% |
| Spanish Americans | 0.0 /100 | #312 | Tragic 13.6% |
| Cree | 0.0 /100 | #313 | Tragic 13.7% |
| Blacks/African Americans | 0.0 /100 | #314 | Tragic 13.7% |