Korean vs Shoshone Disability
COMPARE
Korean
Shoshone
Disability
Disability Comparison
Koreans
Shoshone
11.3%
DISABILITY
93.8/ 100
METRIC RATING
118th/ 347
METRIC RANK
13.5%
DISABILITY
0.0/ 100
METRIC RATING
307th/ 347
METRIC RANK
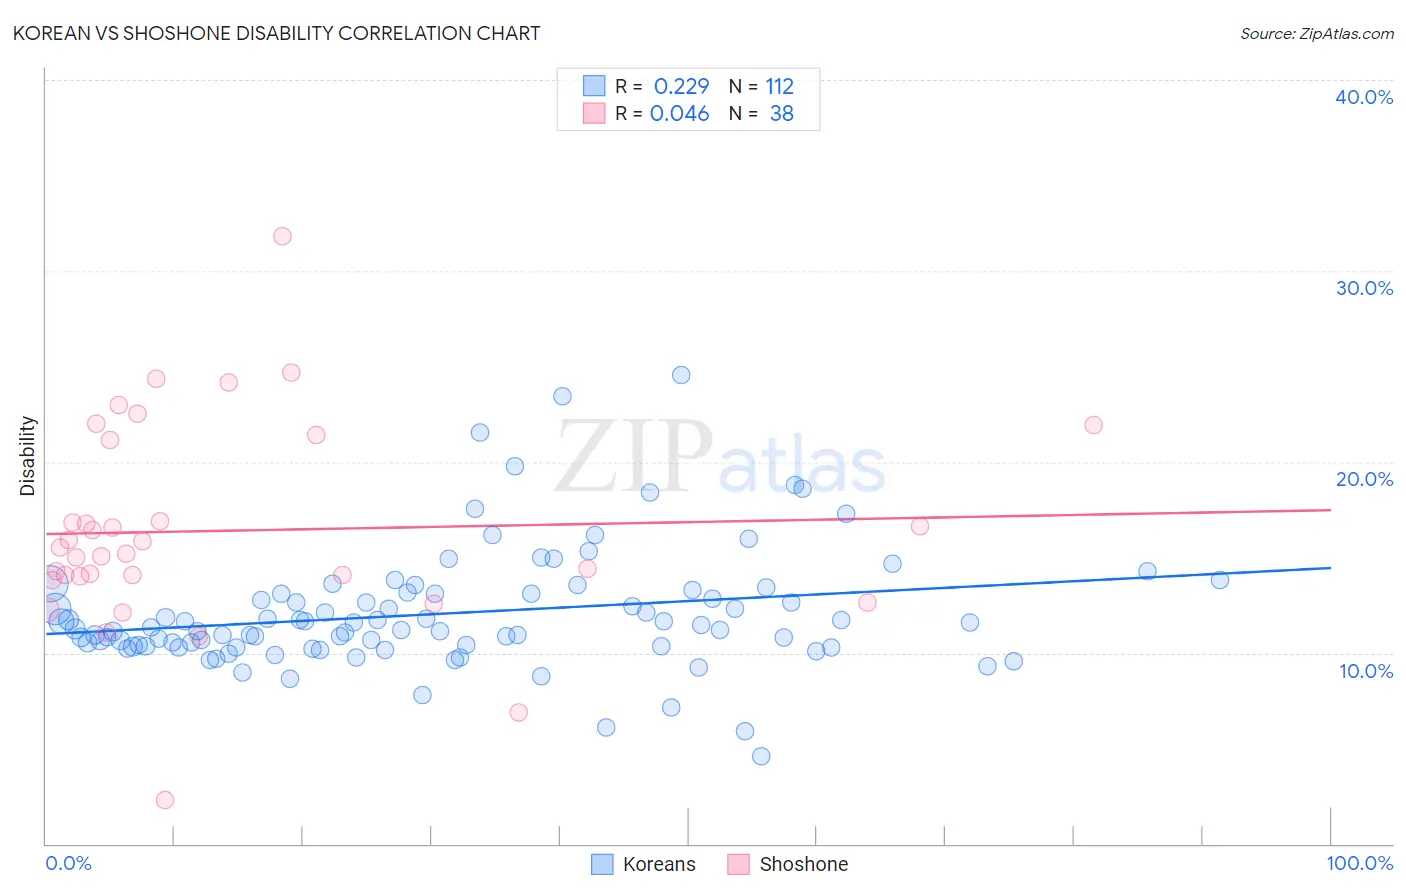
Korean vs Shoshone Disability Correlation Chart
The statistical analysis conducted on geographies consisting of 510,851,171 people shows a weak positive correlation between the proportion of Koreans and percentage of population with a disability in the United States with a correlation coefficient (R) of 0.229 and weighted average of 11.3%. Similarly, the statistical analysis conducted on geographies consisting of 66,619,944 people shows no correlation between the proportion of Shoshone and percentage of population with a disability in the United States with a correlation coefficient (R) of 0.046 and weighted average of 13.5%, a difference of 19.1%.
Disability Correlation Summary
| Measurement | Korean | Shoshone |
| Minimum | 4.6% | 2.3% |
| Maximum | 24.5% | 31.8% |
| Range | 20.0% | 29.5% |
| Mean | 12.1% | 16.4% |
| Median | 11.3% | 15.3% |
| Interquartile 25% (IQ1) | 10.3% | 14.0% |
| Interquartile 75% (IQ3) | 13.1% | 21.2% |
| Interquartile Range (IQR) | 2.8% | 7.1% |
| Standard Deviation (Sample) | 3.1% | 5.4% |
| Standard Deviation (Population) | 3.1% | 5.3% |
Similar Demographics by Disability
Demographics Similar to Koreans by Disability
In terms of disability, the demographic groups most similar to Koreans are Luxembourger (11.3%, a difference of 0.010%), Central American (11.4%, a difference of 0.050%), Immigrants from North Macedonia (11.4%, a difference of 0.060%), Immigrants from Northern Europe (11.3%, a difference of 0.070%), and Immigrants from Costa Rica (11.4%, a difference of 0.070%).
| Demographics | Rating | Rank | Disability |
| Immigrants | South Eastern Asia | 95.4 /100 | #111 | Exceptional 11.3% |
| Immigrants | Uzbekistan | 94.9 /100 | #112 | Exceptional 11.3% |
| Guyanese | 94.7 /100 | #113 | Exceptional 11.3% |
| Immigrants | Syria | 94.7 /100 | #114 | Exceptional 11.3% |
| Immigrants | Philippines | 94.6 /100 | #115 | Exceptional 11.3% |
| Immigrants | Northern Europe | 94.1 /100 | #116 | Exceptional 11.3% |
| Luxembourgers | 93.9 /100 | #117 | Exceptional 11.3% |
| Koreans | 93.8 /100 | #118 | Exceptional 11.3% |
| Central Americans | 93.5 /100 | #119 | Exceptional 11.4% |
| Immigrants | North Macedonia | 93.5 /100 | #120 | Exceptional 11.4% |
| Immigrants | Costa Rica | 93.4 /100 | #121 | Exceptional 11.4% |
| Brazilians | 93.3 /100 | #122 | Exceptional 11.4% |
| South Africans | 92.3 /100 | #123 | Exceptional 11.4% |
| South American Indians | 92.2 /100 | #124 | Exceptional 11.4% |
| Costa Ricans | 91.9 /100 | #125 | Exceptional 11.4% |
Demographics Similar to Shoshone by Disability
In terms of disability, the demographic groups most similar to Shoshone are Cape Verdean (13.5%, a difference of 0.050%), French American Indian (13.5%, a difference of 0.090%), Tlingit-Haida (13.5%, a difference of 0.18%), French Canadian (13.4%, a difference of 0.66%), and Blackfeet (13.6%, a difference of 0.71%).
| Demographics | Rating | Rank | Disability |
| Pennsylvania Germans | 0.0 /100 | #300 | Tragic 13.2% |
| Immigrants | Micronesia | 0.0 /100 | #301 | Tragic 13.2% |
| Arapaho | 0.0 /100 | #302 | Tragic 13.2% |
| Scotch-Irish | 0.0 /100 | #303 | Tragic 13.3% |
| Yakama | 0.0 /100 | #304 | Tragic 13.4% |
| French Canadians | 0.0 /100 | #305 | Tragic 13.4% |
| Cape Verdeans | 0.0 /100 | #306 | Tragic 13.5% |
| Shoshone | 0.0 /100 | #307 | Tragic 13.5% |
| French American Indians | 0.0 /100 | #308 | Tragic 13.5% |
| Tlingit-Haida | 0.0 /100 | #309 | Tragic 13.5% |
| Blackfeet | 0.0 /100 | #310 | Tragic 13.6% |
| Delaware | 0.0 /100 | #311 | Tragic 13.6% |
| Spanish Americans | 0.0 /100 | #312 | Tragic 13.6% |
| Cree | 0.0 /100 | #313 | Tragic 13.7% |
| Blacks/African Americans | 0.0 /100 | #314 | Tragic 13.7% |