Sioux vs Immigrants from Sierra Leone Disability
COMPARE
Sioux
Immigrants from Sierra Leone
Disability
Disability Comparison
Sioux
Immigrants from Sierra Leone
12.8%
DISABILITY
0.0/ 100
METRIC RATING
275th/ 347
METRIC RANK
11.1%
DISABILITY
99.0/ 100
METRIC RATING
84th/ 347
METRIC RANK
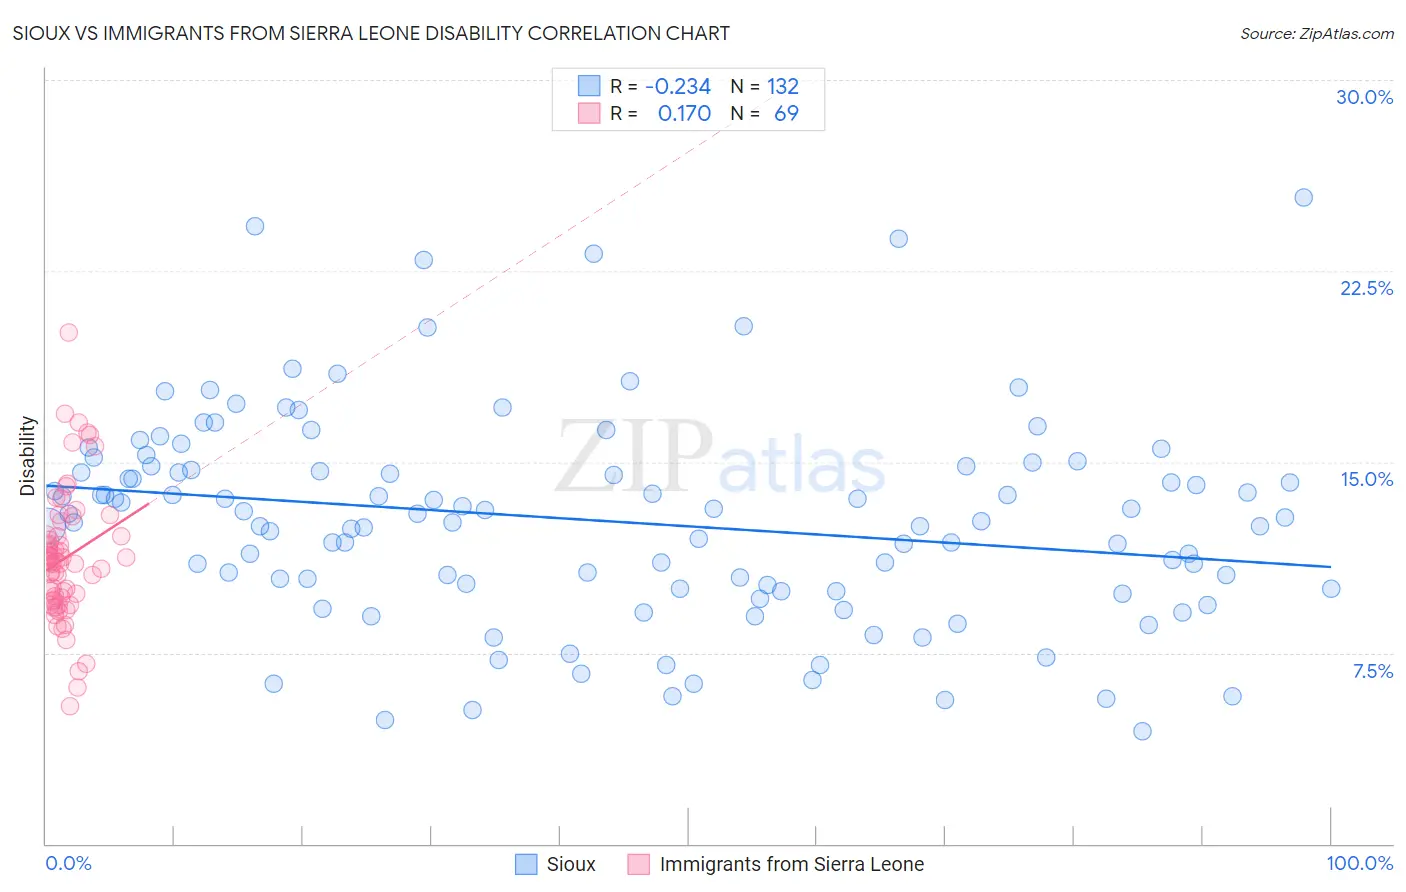
Sioux vs Immigrants from Sierra Leone Disability Correlation Chart
The statistical analysis conducted on geographies consisting of 234,155,753 people shows a weak negative correlation between the proportion of Sioux and percentage of population with a disability in the United States with a correlation coefficient (R) of -0.234 and weighted average of 12.8%. Similarly, the statistical analysis conducted on geographies consisting of 101,651,633 people shows a poor positive correlation between the proportion of Immigrants from Sierra Leone and percentage of population with a disability in the United States with a correlation coefficient (R) of 0.170 and weighted average of 11.1%, a difference of 15.1%.
Disability Correlation Summary
| Measurement | Sioux | Immigrants from Sierra Leone |
| Minimum | 4.4% | 5.4% |
| Maximum | 25.4% | 20.1% |
| Range | 21.0% | 14.7% |
| Mean | 12.7% | 11.2% |
| Median | 12.7% | 11.1% |
| Interquartile 25% (IQ1) | 10.0% | 9.6% |
| Interquartile 75% (IQ3) | 14.8% | 12.1% |
| Interquartile Range (IQR) | 4.7% | 2.6% |
| Standard Deviation (Sample) | 4.1% | 2.6% |
| Standard Deviation (Population) | 4.1% | 2.6% |
Similar Demographics by Disability
Demographics Similar to Sioux by Disability
In terms of disability, the demographic groups most similar to Sioux are Nepalese (12.8%, a difference of 0.080%), Hmong (12.8%, a difference of 0.15%), Dutch (12.8%, a difference of 0.20%), German (12.8%, a difference of 0.37%), and Fijian (12.8%, a difference of 0.46%).
| Demographics | Rating | Rank | Disability |
| Bangladeshis | 0.1 /100 | #268 | Tragic 12.6% |
| Immigrants | Dominican Republic | 0.1 /100 | #269 | Tragic 12.6% |
| Portuguese | 0.1 /100 | #270 | Tragic 12.6% |
| Immigrants | Yemen | 0.1 /100 | #271 | Tragic 12.6% |
| Dominicans | 0.0 /100 | #272 | Tragic 12.7% |
| Finns | 0.0 /100 | #273 | Tragic 12.7% |
| Nepalese | 0.0 /100 | #274 | Tragic 12.8% |
| Sioux | 0.0 /100 | #275 | Tragic 12.8% |
| Hmong | 0.0 /100 | #276 | Tragic 12.8% |
| Dutch | 0.0 /100 | #277 | Tragic 12.8% |
| Germans | 0.0 /100 | #278 | Tragic 12.8% |
| Fijians | 0.0 /100 | #279 | Tragic 12.8% |
| Spanish | 0.0 /100 | #280 | Tragic 12.8% |
| Immigrants | Portugal | 0.0 /100 | #281 | Tragic 12.9% |
| Scottish | 0.0 /100 | #282 | Tragic 12.9% |
Demographics Similar to Immigrants from Sierra Leone by Disability
In terms of disability, the demographic groups most similar to Immigrants from Sierra Leone are Immigrants from Switzerland (11.1%, a difference of 0.010%), Chilean (11.1%, a difference of 0.050%), Immigrants from Poland (11.1%, a difference of 0.090%), Immigrants from Belarus (11.1%, a difference of 0.15%), and Immigrants from Russia (11.1%, a difference of 0.15%).
| Demographics | Rating | Rank | Disability |
| Immigrants | Belgium | 99.3 /100 | #77 | Exceptional 11.0% |
| Immigrants | Cameroon | 99.3 /100 | #78 | Exceptional 11.1% |
| Immigrants | Jordan | 99.3 /100 | #79 | Exceptional 11.1% |
| Immigrants | Ireland | 99.3 /100 | #80 | Exceptional 11.1% |
| Immigrants | Poland | 99.1 /100 | #81 | Exceptional 11.1% |
| Chileans | 99.1 /100 | #82 | Exceptional 11.1% |
| Immigrants | Switzerland | 99.0 /100 | #83 | Exceptional 11.1% |
| Immigrants | Sierra Leone | 99.0 /100 | #84 | Exceptional 11.1% |
| Immigrants | Belarus | 98.9 /100 | #85 | Exceptional 11.1% |
| Immigrants | Russia | 98.9 /100 | #86 | Exceptional 11.1% |
| Palestinians | 98.9 /100 | #87 | Exceptional 11.1% |
| Immigrants | Romania | 98.5 /100 | #88 | Exceptional 11.2% |
| Immigrants | South Africa | 98.2 /100 | #89 | Exceptional 11.2% |
| Immigrants | Brazil | 98.1 /100 | #90 | Exceptional 11.2% |
| Immigrants | Western Asia | 98.1 /100 | #91 | Exceptional 11.2% |