Sioux vs Immigrants from Eastern Europe Disability
COMPARE
Sioux
Immigrants from Eastern Europe
Disability
Disability Comparison
Sioux
Immigrants from Eastern Europe
12.8%
DISABILITY
0.0/ 100
METRIC RATING
275th/ 347
METRIC RANK
11.3%
DISABILITY
96.3/ 100
METRIC RATING
106th/ 347
METRIC RANK
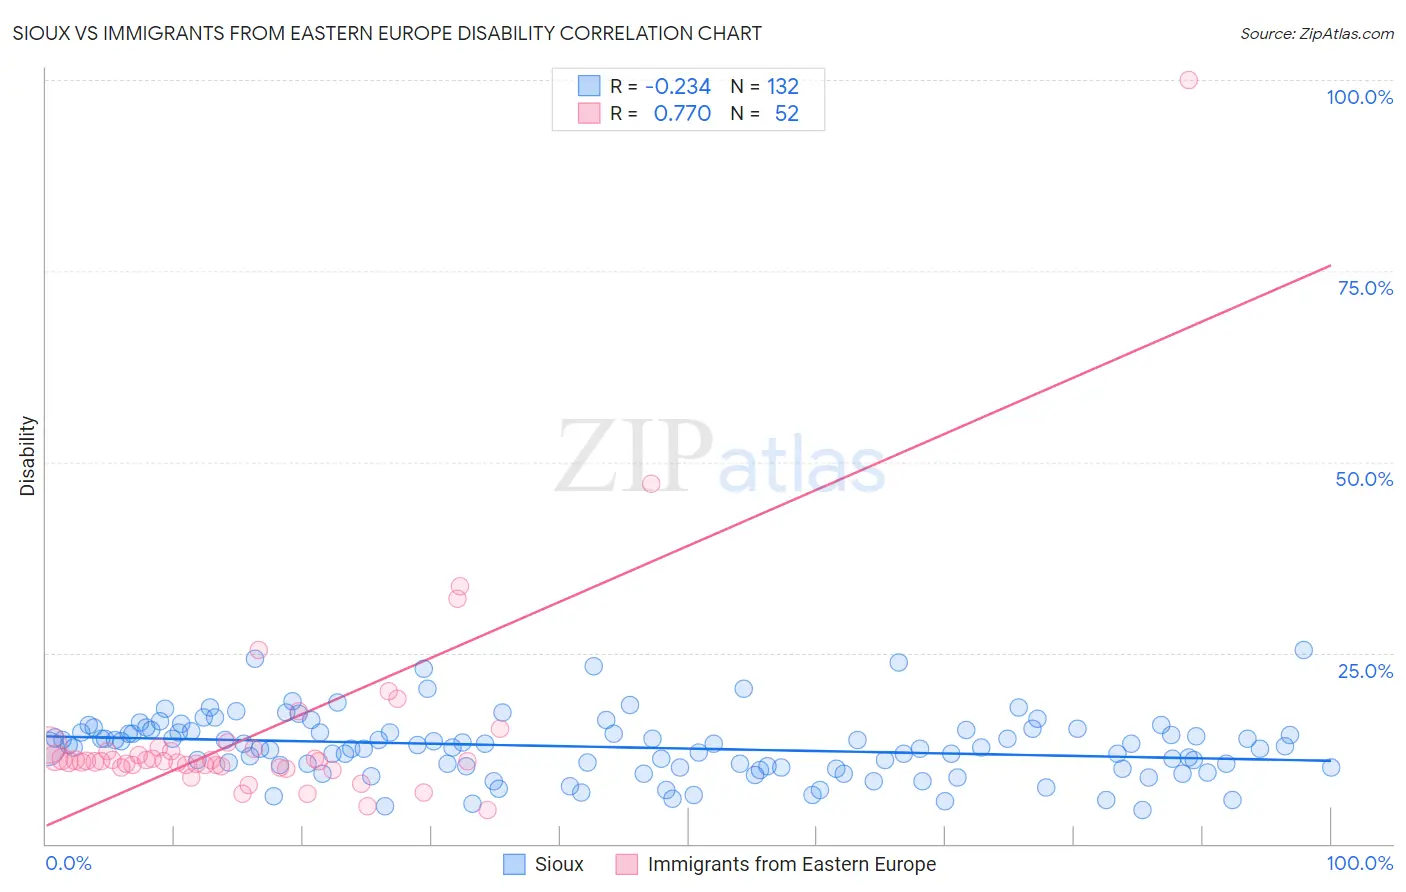
Sioux vs Immigrants from Eastern Europe Disability Correlation Chart
The statistical analysis conducted on geographies consisting of 234,155,753 people shows a weak negative correlation between the proportion of Sioux and percentage of population with a disability in the United States with a correlation coefficient (R) of -0.234 and weighted average of 12.8%. Similarly, the statistical analysis conducted on geographies consisting of 475,819,373 people shows a strong positive correlation between the proportion of Immigrants from Eastern Europe and percentage of population with a disability in the United States with a correlation coefficient (R) of 0.770 and weighted average of 11.3%, a difference of 13.3%.
Disability Correlation Summary
| Measurement | Sioux | Immigrants from Eastern Europe |
| Minimum | 4.4% | 4.4% |
| Maximum | 25.4% | 100.0% |
| Range | 21.0% | 95.6% |
| Mean | 12.7% | 14.4% |
| Median | 12.7% | 10.8% |
| Interquartile 25% (IQ1) | 10.0% | 10.2% |
| Interquartile 75% (IQ3) | 14.8% | 12.3% |
| Interquartile Range (IQR) | 4.7% | 2.1% |
| Standard Deviation (Sample) | 4.1% | 14.1% |
| Standard Deviation (Population) | 4.1% | 14.0% |
Similar Demographics by Disability
Demographics Similar to Sioux by Disability
In terms of disability, the demographic groups most similar to Sioux are Nepalese (12.8%, a difference of 0.080%), Hmong (12.8%, a difference of 0.15%), Dutch (12.8%, a difference of 0.20%), German (12.8%, a difference of 0.37%), and Fijian (12.8%, a difference of 0.46%).
| Demographics | Rating | Rank | Disability |
| Bangladeshis | 0.1 /100 | #268 | Tragic 12.6% |
| Immigrants | Dominican Republic | 0.1 /100 | #269 | Tragic 12.6% |
| Portuguese | 0.1 /100 | #270 | Tragic 12.6% |
| Immigrants | Yemen | 0.1 /100 | #271 | Tragic 12.6% |
| Dominicans | 0.0 /100 | #272 | Tragic 12.7% |
| Finns | 0.0 /100 | #273 | Tragic 12.7% |
| Nepalese | 0.0 /100 | #274 | Tragic 12.8% |
| Sioux | 0.0 /100 | #275 | Tragic 12.8% |
| Hmong | 0.0 /100 | #276 | Tragic 12.8% |
| Dutch | 0.0 /100 | #277 | Tragic 12.8% |
| Germans | 0.0 /100 | #278 | Tragic 12.8% |
| Fijians | 0.0 /100 | #279 | Tragic 12.8% |
| Spanish | 0.0 /100 | #280 | Tragic 12.8% |
| Immigrants | Portugal | 0.0 /100 | #281 | Tragic 12.9% |
| Scottish | 0.0 /100 | #282 | Tragic 12.9% |
Demographics Similar to Immigrants from Eastern Europe by Disability
In terms of disability, the demographic groups most similar to Immigrants from Eastern Europe are Nicaraguan (11.3%, a difference of 0.020%), Immigrants from Kazakhstan (11.3%, a difference of 0.030%), Immigrants from Uruguay (11.3%, a difference of 0.040%), Immigrants (11.3%, a difference of 0.040%), and Immigrants from Nigeria (11.3%, a difference of 0.10%).
| Demographics | Rating | Rank | Disability |
| Immigrants | Czechoslovakia | 97.4 /100 | #99 | Exceptional 11.2% |
| Immigrants | Greece | 96.9 /100 | #100 | Exceptional 11.3% |
| Immigrants | Nicaragua | 96.8 /100 | #101 | Exceptional 11.3% |
| Immigrants | Eastern Africa | 96.7 /100 | #102 | Exceptional 11.3% |
| Immigrants | Uruguay | 96.4 /100 | #103 | Exceptional 11.3% |
| Immigrants | Immigrants | 96.4 /100 | #104 | Exceptional 11.3% |
| Immigrants | Kazakhstan | 96.4 /100 | #105 | Exceptional 11.3% |
| Immigrants | Eastern Europe | 96.3 /100 | #106 | Exceptional 11.3% |
| Nicaraguans | 96.2 /100 | #107 | Exceptional 11.3% |
| Immigrants | Nigeria | 96.0 /100 | #108 | Exceptional 11.3% |
| Immigrants | Uganda | 95.7 /100 | #109 | Exceptional 11.3% |
| Immigrants | Denmark | 95.6 /100 | #110 | Exceptional 11.3% |
| Immigrants | South Eastern Asia | 95.4 /100 | #111 | Exceptional 11.3% |
| Immigrants | Uzbekistan | 94.9 /100 | #112 | Exceptional 11.3% |
| Guyanese | 94.7 /100 | #113 | Exceptional 11.3% |