Hawaiian vs Shoshone Disability
COMPARE
Hawaiian
Shoshone
Disability
Disability Comparison
Hawaiians
Shoshone
12.5%
DISABILITY
0.2/ 100
METRIC RATING
263rd/ 347
METRIC RANK
13.5%
DISABILITY
0.0/ 100
METRIC RATING
307th/ 347
METRIC RANK
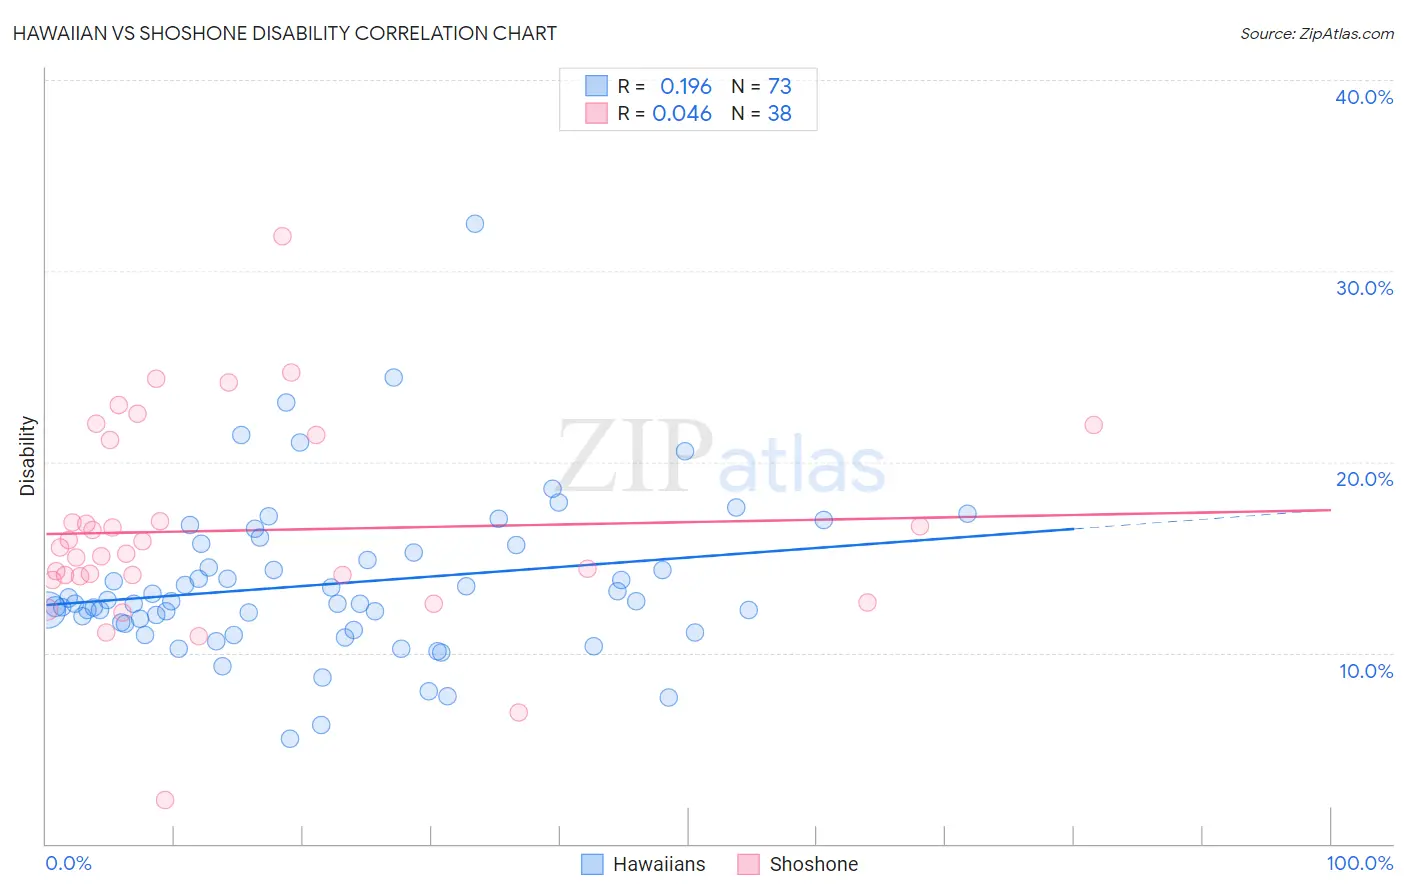
Hawaiian vs Shoshone Disability Correlation Chart
The statistical analysis conducted on geographies consisting of 327,510,091 people shows a poor positive correlation between the proportion of Hawaiians and percentage of population with a disability in the United States with a correlation coefficient (R) of 0.196 and weighted average of 12.5%. Similarly, the statistical analysis conducted on geographies consisting of 66,619,944 people shows no correlation between the proportion of Shoshone and percentage of population with a disability in the United States with a correlation coefficient (R) of 0.046 and weighted average of 13.5%, a difference of 8.3%.
Disability Correlation Summary
| Measurement | Hawaiian | Shoshone |
| Minimum | 5.5% | 2.3% |
| Maximum | 32.5% | 31.8% |
| Range | 27.0% | 29.5% |
| Mean | 13.6% | 16.4% |
| Median | 12.6% | 15.3% |
| Interquartile 25% (IQ1) | 11.4% | 14.0% |
| Interquartile 75% (IQ3) | 15.5% | 21.2% |
| Interquartile Range (IQR) | 4.1% | 7.1% |
| Standard Deviation (Sample) | 4.2% | 5.4% |
| Standard Deviation (Population) | 4.2% | 5.3% |
Similar Demographics by Disability
Demographics Similar to Hawaiians by Disability
In terms of disability, the demographic groups most similar to Hawaiians are Immigrants from Germany (12.5%, a difference of 0.11%), U.S. Virgin Islander (12.5%, a difference of 0.13%), Native Hawaiian (12.5%, a difference of 0.20%), Czechoslovakian (12.5%, a difference of 0.29%), and Spaniard (12.5%, a difference of 0.37%).
| Demographics | Rating | Rank | Disability |
| Immigrants | Dominica | 0.6 /100 | #256 | Tragic 12.4% |
| Immigrants | Laos | 0.5 /100 | #257 | Tragic 12.4% |
| Slavs | 0.5 /100 | #258 | Tragic 12.4% |
| Canadians | 0.4 /100 | #259 | Tragic 12.4% |
| Immigrants | Liberia | 0.4 /100 | #260 | Tragic 12.4% |
| Scandinavians | 0.4 /100 | #261 | Tragic 12.4% |
| Native Hawaiians | 0.3 /100 | #262 | Tragic 12.5% |
| Hawaiians | 0.2 /100 | #263 | Tragic 12.5% |
| Immigrants | Germany | 0.2 /100 | #264 | Tragic 12.5% |
| U.S. Virgin Islanders | 0.2 /100 | #265 | Tragic 12.5% |
| Czechoslovakians | 0.2 /100 | #266 | Tragic 12.5% |
| Spaniards | 0.2 /100 | #267 | Tragic 12.5% |
| Bangladeshis | 0.1 /100 | #268 | Tragic 12.6% |
| Immigrants | Dominican Republic | 0.1 /100 | #269 | Tragic 12.6% |
| Portuguese | 0.1 /100 | #270 | Tragic 12.6% |
Demographics Similar to Shoshone by Disability
In terms of disability, the demographic groups most similar to Shoshone are Cape Verdean (13.5%, a difference of 0.050%), French American Indian (13.5%, a difference of 0.090%), Tlingit-Haida (13.5%, a difference of 0.18%), French Canadian (13.4%, a difference of 0.66%), and Blackfeet (13.6%, a difference of 0.71%).
| Demographics | Rating | Rank | Disability |
| Pennsylvania Germans | 0.0 /100 | #300 | Tragic 13.2% |
| Immigrants | Micronesia | 0.0 /100 | #301 | Tragic 13.2% |
| Arapaho | 0.0 /100 | #302 | Tragic 13.2% |
| Scotch-Irish | 0.0 /100 | #303 | Tragic 13.3% |
| Yakama | 0.0 /100 | #304 | Tragic 13.4% |
| French Canadians | 0.0 /100 | #305 | Tragic 13.4% |
| Cape Verdeans | 0.0 /100 | #306 | Tragic 13.5% |
| Shoshone | 0.0 /100 | #307 | Tragic 13.5% |
| French American Indians | 0.0 /100 | #308 | Tragic 13.5% |
| Tlingit-Haida | 0.0 /100 | #309 | Tragic 13.5% |
| Blackfeet | 0.0 /100 | #310 | Tragic 13.6% |
| Delaware | 0.0 /100 | #311 | Tragic 13.6% |
| Spanish Americans | 0.0 /100 | #312 | Tragic 13.6% |
| Cree | 0.0 /100 | #313 | Tragic 13.7% |
| Blacks/African Americans | 0.0 /100 | #314 | Tragic 13.7% |