Immigrants from Egypt vs Shoshone Disability
COMPARE
Immigrants from Egypt
Shoshone
Disability
Disability Comparison
Immigrants from Egypt
Shoshone
10.6%
DISABILITY
100.0/ 100
METRIC RATING
31st/ 347
METRIC RANK
13.5%
DISABILITY
0.0/ 100
METRIC RATING
307th/ 347
METRIC RANK
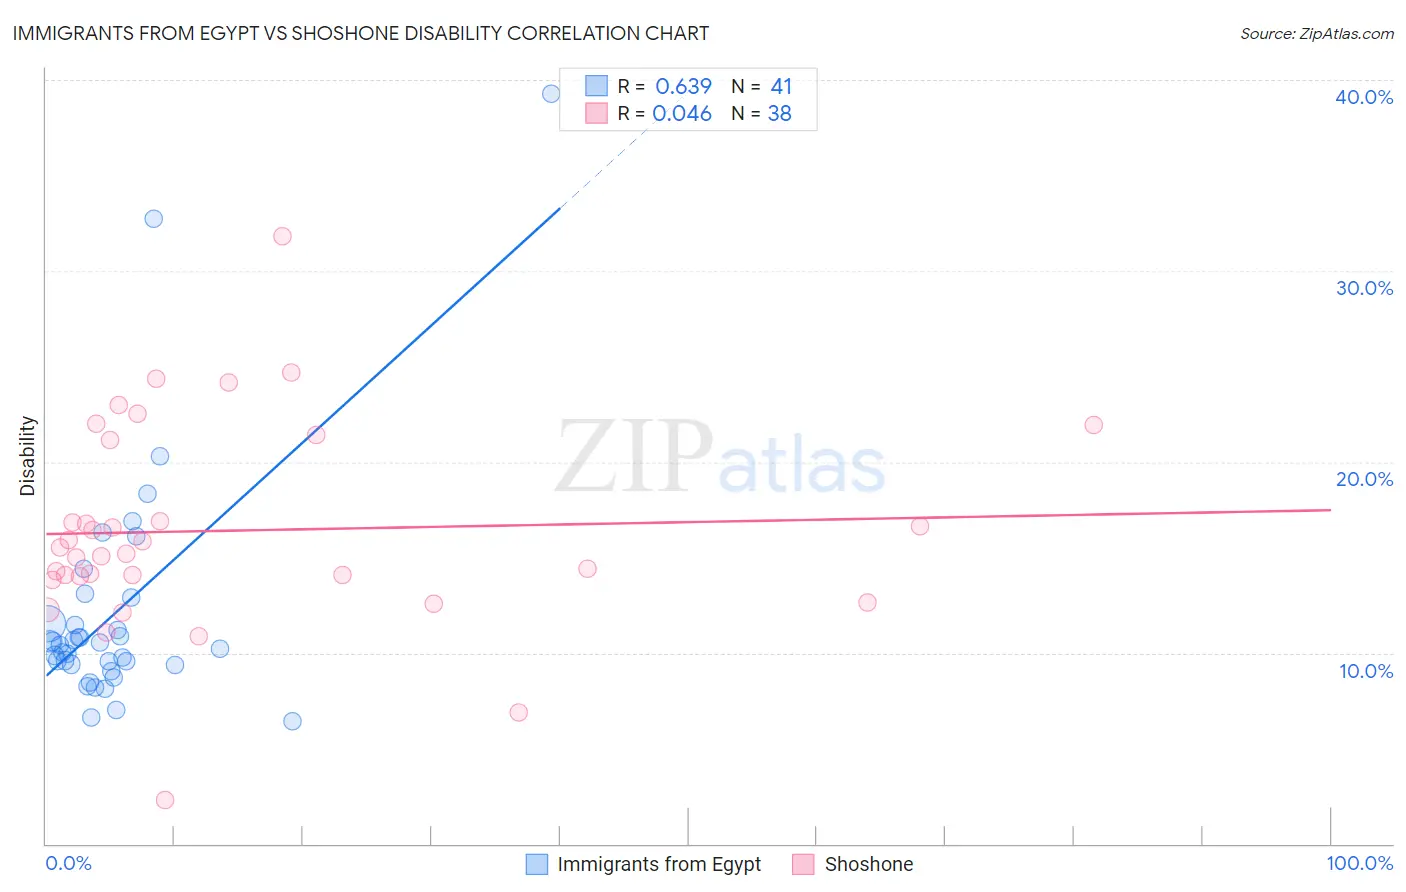
Immigrants from Egypt vs Shoshone Disability Correlation Chart
The statistical analysis conducted on geographies consisting of 245,492,432 people shows a significant positive correlation between the proportion of Immigrants from Egypt and percentage of population with a disability in the United States with a correlation coefficient (R) of 0.639 and weighted average of 10.6%. Similarly, the statistical analysis conducted on geographies consisting of 66,619,944 people shows no correlation between the proportion of Shoshone and percentage of population with a disability in the United States with a correlation coefficient (R) of 0.046 and weighted average of 13.5%, a difference of 27.0%.
Disability Correlation Summary
| Measurement | Immigrants from Egypt | Shoshone |
| Minimum | 6.4% | 2.3% |
| Maximum | 39.3% | 31.8% |
| Range | 32.9% | 29.5% |
| Mean | 12.1% | 16.4% |
| Median | 10.4% | 15.3% |
| Interquartile 25% (IQ1) | 9.4% | 14.0% |
| Interquartile 75% (IQ3) | 12.2% | 21.2% |
| Interquartile Range (IQR) | 2.8% | 7.1% |
| Standard Deviation (Sample) | 6.3% | 5.4% |
| Standard Deviation (Population) | 6.2% | 5.3% |
Similar Demographics by Disability
Demographics Similar to Immigrants from Egypt by Disability
In terms of disability, the demographic groups most similar to Immigrants from Egypt are Immigrants from Turkey (10.6%, a difference of 0.070%), Paraguayan (10.6%, a difference of 0.10%), Immigrants from Argentina (10.6%, a difference of 0.23%), Egyptian (10.6%, a difference of 0.35%), and Immigrants from Kuwait (10.7%, a difference of 0.35%).
| Demographics | Rating | Rank | Disability |
| Venezuelans | 100.0 /100 | #24 | Exceptional 10.5% |
| Immigrants | Malaysia | 100.0 /100 | #25 | Exceptional 10.6% |
| Argentineans | 100.0 /100 | #26 | Exceptional 10.6% |
| Cypriots | 100.0 /100 | #27 | Exceptional 10.6% |
| Egyptians | 100.0 /100 | #28 | Exceptional 10.6% |
| Immigrants | Argentina | 100.0 /100 | #29 | Exceptional 10.6% |
| Immigrants | Turkey | 100.0 /100 | #30 | Exceptional 10.6% |
| Immigrants | Egypt | 100.0 /100 | #31 | Exceptional 10.6% |
| Paraguayans | 100.0 /100 | #32 | Exceptional 10.6% |
| Immigrants | Kuwait | 100.0 /100 | #33 | Exceptional 10.7% |
| Immigrants | Ethiopia | 100.0 /100 | #34 | Exceptional 10.7% |
| Immigrants | Indonesia | 100.0 /100 | #35 | Exceptional 10.7% |
| Ethiopians | 100.0 /100 | #36 | Exceptional 10.7% |
| Turks | 100.0 /100 | #37 | Exceptional 10.7% |
| Afghans | 99.9 /100 | #38 | Exceptional 10.8% |
Demographics Similar to Shoshone by Disability
In terms of disability, the demographic groups most similar to Shoshone are Cape Verdean (13.5%, a difference of 0.050%), French American Indian (13.5%, a difference of 0.090%), Tlingit-Haida (13.5%, a difference of 0.18%), French Canadian (13.4%, a difference of 0.66%), and Blackfeet (13.6%, a difference of 0.71%).
| Demographics | Rating | Rank | Disability |
| Pennsylvania Germans | 0.0 /100 | #300 | Tragic 13.2% |
| Immigrants | Micronesia | 0.0 /100 | #301 | Tragic 13.2% |
| Arapaho | 0.0 /100 | #302 | Tragic 13.2% |
| Scotch-Irish | 0.0 /100 | #303 | Tragic 13.3% |
| Yakama | 0.0 /100 | #304 | Tragic 13.4% |
| French Canadians | 0.0 /100 | #305 | Tragic 13.4% |
| Cape Verdeans | 0.0 /100 | #306 | Tragic 13.5% |
| Shoshone | 0.0 /100 | #307 | Tragic 13.5% |
| French American Indians | 0.0 /100 | #308 | Tragic 13.5% |
| Tlingit-Haida | 0.0 /100 | #309 | Tragic 13.5% |
| Blackfeet | 0.0 /100 | #310 | Tragic 13.6% |
| Delaware | 0.0 /100 | #311 | Tragic 13.6% |
| Spanish Americans | 0.0 /100 | #312 | Tragic 13.6% |
| Cree | 0.0 /100 | #313 | Tragic 13.7% |
| Blacks/African Americans | 0.0 /100 | #314 | Tragic 13.7% |