Sioux vs Russian Disability
COMPARE
Sioux
Russian
Disability
Disability Comparison
Sioux
Russians
12.8%
DISABILITY
0.0/ 100
METRIC RATING
275th/ 347
METRIC RANK
11.5%
DISABILITY
86.8/ 100
METRIC RATING
140th/ 347
METRIC RANK
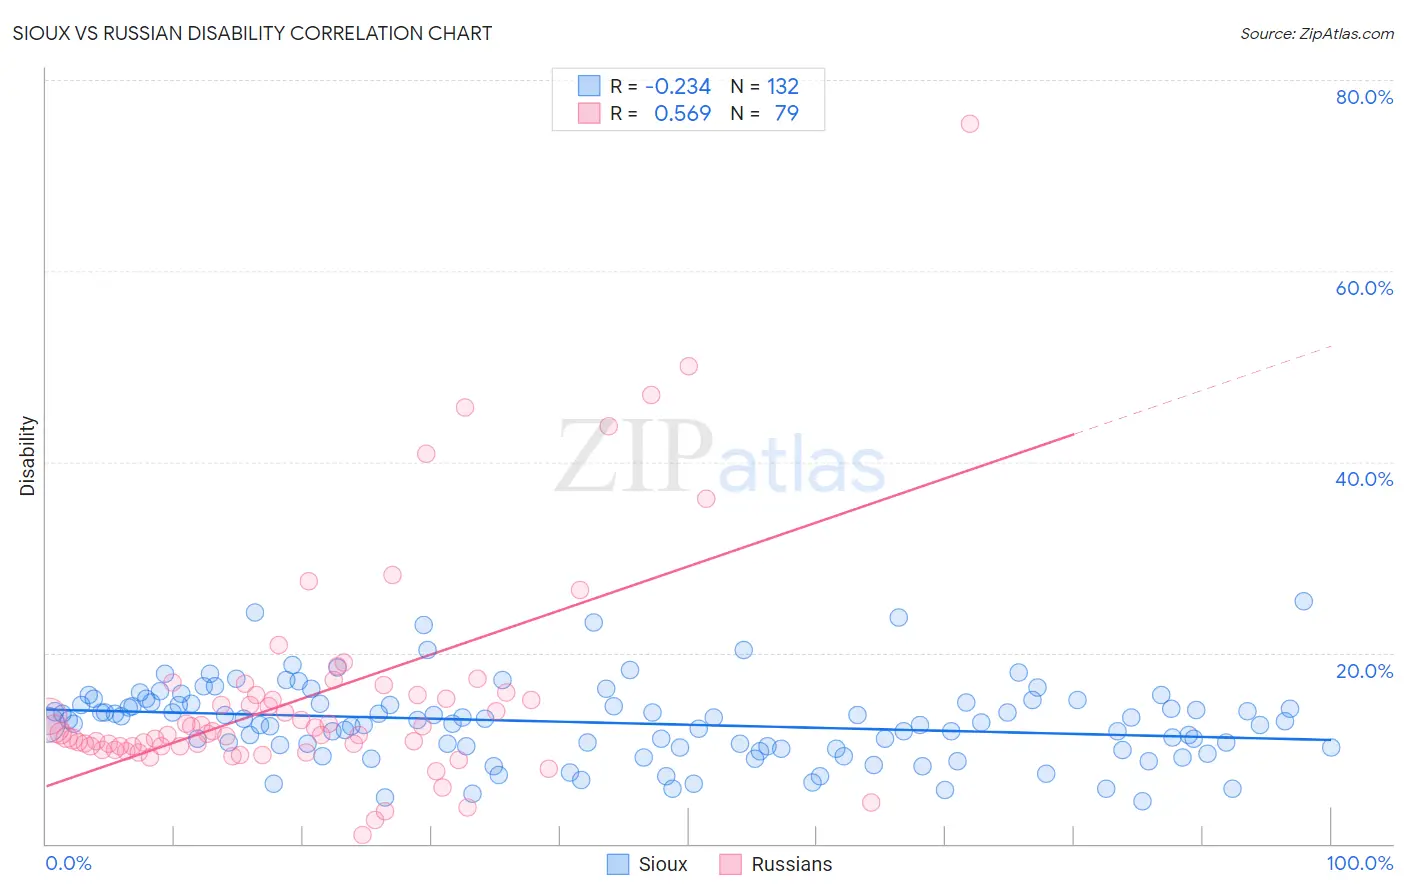
Sioux vs Russian Disability Correlation Chart
The statistical analysis conducted on geographies consisting of 234,155,753 people shows a weak negative correlation between the proportion of Sioux and percentage of population with a disability in the United States with a correlation coefficient (R) of -0.234 and weighted average of 12.8%. Similarly, the statistical analysis conducted on geographies consisting of 512,171,933 people shows a substantial positive correlation between the proportion of Russians and percentage of population with a disability in the United States with a correlation coefficient (R) of 0.569 and weighted average of 11.5%, a difference of 11.5%.
Disability Correlation Summary
| Measurement | Sioux | Russian |
| Minimum | 4.4% | 0.92% |
| Maximum | 25.4% | 75.4% |
| Range | 21.0% | 74.5% |
| Mean | 12.7% | 15.4% |
| Median | 12.7% | 11.6% |
| Interquartile 25% (IQ1) | 10.0% | 10.2% |
| Interquartile 75% (IQ3) | 14.8% | 15.6% |
| Interquartile Range (IQR) | 4.7% | 5.4% |
| Standard Deviation (Sample) | 4.1% | 11.9% |
| Standard Deviation (Population) | 4.1% | 11.8% |
Similar Demographics by Disability
Demographics Similar to Sioux by Disability
In terms of disability, the demographic groups most similar to Sioux are Nepalese (12.8%, a difference of 0.080%), Hmong (12.8%, a difference of 0.15%), Dutch (12.8%, a difference of 0.20%), German (12.8%, a difference of 0.37%), and Fijian (12.8%, a difference of 0.46%).
| Demographics | Rating | Rank | Disability |
| Bangladeshis | 0.1 /100 | #268 | Tragic 12.6% |
| Immigrants | Dominican Republic | 0.1 /100 | #269 | Tragic 12.6% |
| Portuguese | 0.1 /100 | #270 | Tragic 12.6% |
| Immigrants | Yemen | 0.1 /100 | #271 | Tragic 12.6% |
| Dominicans | 0.0 /100 | #272 | Tragic 12.7% |
| Finns | 0.0 /100 | #273 | Tragic 12.7% |
| Nepalese | 0.0 /100 | #274 | Tragic 12.8% |
| Sioux | 0.0 /100 | #275 | Tragic 12.8% |
| Hmong | 0.0 /100 | #276 | Tragic 12.8% |
| Dutch | 0.0 /100 | #277 | Tragic 12.8% |
| Germans | 0.0 /100 | #278 | Tragic 12.8% |
| Fijians | 0.0 /100 | #279 | Tragic 12.8% |
| Spanish | 0.0 /100 | #280 | Tragic 12.8% |
| Immigrants | Portugal | 0.0 /100 | #281 | Tragic 12.9% |
| Scottish | 0.0 /100 | #282 | Tragic 12.9% |
Demographics Similar to Russians by Disability
In terms of disability, the demographic groups most similar to Russians are New Zealander (11.5%, a difference of 0.020%), Ghanaian (11.5%, a difference of 0.020%), Kenyan (11.5%, a difference of 0.030%), Immigrants from Grenada (11.5%, a difference of 0.070%), and Immigrants from St. Vincent and the Grenadines (11.4%, a difference of 0.10%).
| Demographics | Rating | Rank | Disability |
| Arabs | 89.1 /100 | #133 | Excellent 11.4% |
| Immigrants | Guyana | 88.3 /100 | #134 | Excellent 11.4% |
| Ugandans | 87.9 /100 | #135 | Excellent 11.4% |
| Immigrants | St. Vincent and the Grenadines | 87.8 /100 | #136 | Excellent 11.4% |
| Kenyans | 87.1 /100 | #137 | Excellent 11.5% |
| New Zealanders | 87.0 /100 | #138 | Excellent 11.5% |
| Ghanaians | 87.0 /100 | #139 | Excellent 11.5% |
| Russians | 86.8 /100 | #140 | Excellent 11.5% |
| Immigrants | Grenada | 86.1 /100 | #141 | Excellent 11.5% |
| Immigrants | Sudan | 85.3 /100 | #142 | Excellent 11.5% |
| Moroccans | 83.3 /100 | #143 | Excellent 11.5% |
| Australians | 82.5 /100 | #144 | Excellent 11.5% |
| Nigerians | 81.3 /100 | #145 | Excellent 11.5% |
| Immigrants | Hungary | 79.0 /100 | #146 | Good 11.5% |
| Immigrants | Ukraine | 77.6 /100 | #147 | Good 11.5% |