Immigrants from Honduras vs Shoshone Disability
COMPARE
Immigrants from Honduras
Shoshone
Disability
Disability Comparison
Immigrants from Honduras
Shoshone
11.8%
DISABILITY
37.8/ 100
METRIC RATING
180th/ 347
METRIC RANK
13.5%
DISABILITY
0.0/ 100
METRIC RATING
307th/ 347
METRIC RANK
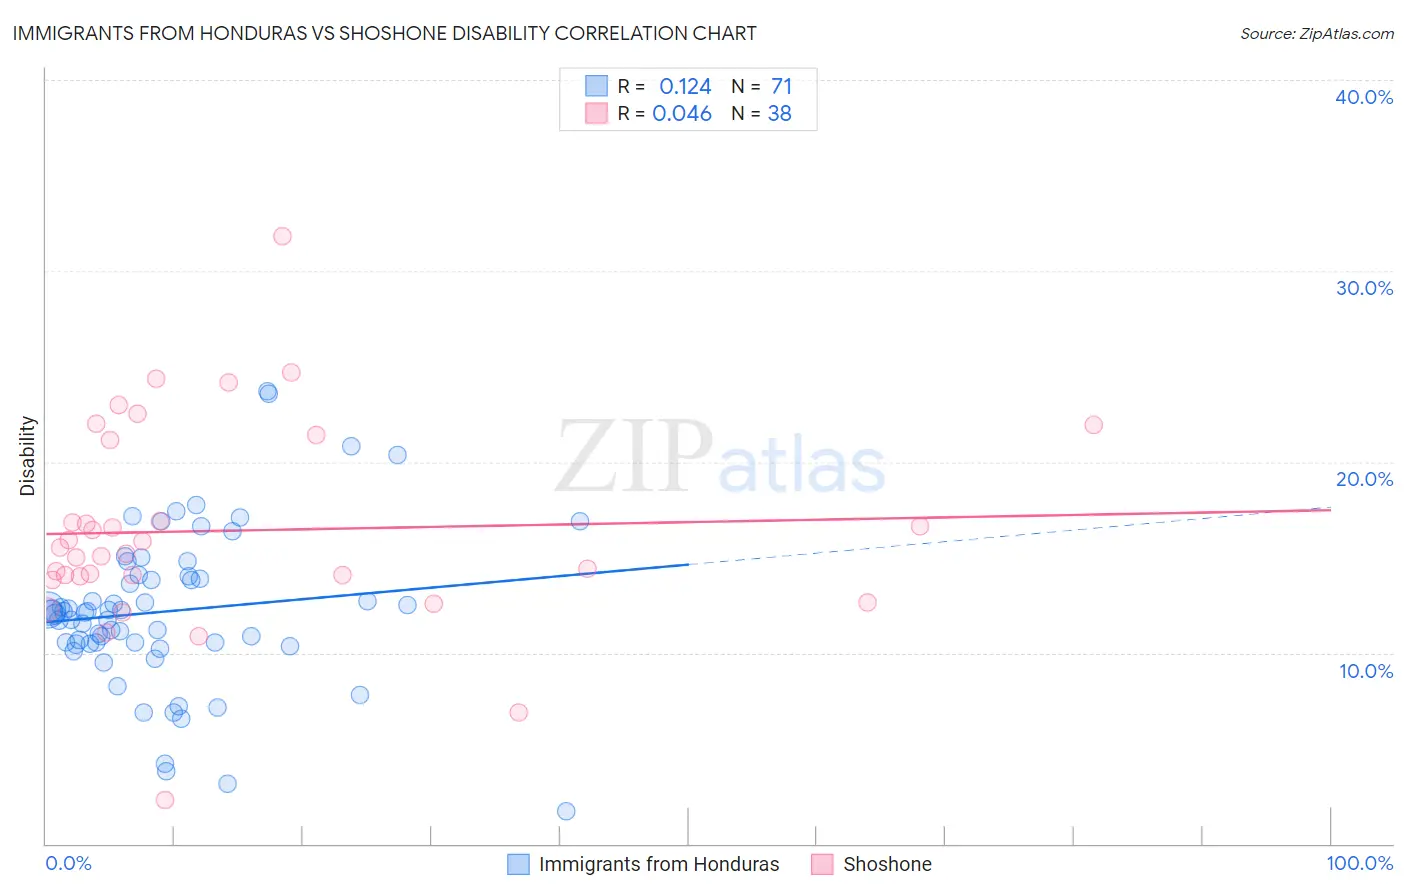
Immigrants from Honduras vs Shoshone Disability Correlation Chart
The statistical analysis conducted on geographies consisting of 322,561,761 people shows a poor positive correlation between the proportion of Immigrants from Honduras and percentage of population with a disability in the United States with a correlation coefficient (R) of 0.124 and weighted average of 11.8%. Similarly, the statistical analysis conducted on geographies consisting of 66,619,944 people shows no correlation between the proportion of Shoshone and percentage of population with a disability in the United States with a correlation coefficient (R) of 0.046 and weighted average of 13.5%, a difference of 14.9%.
Disability Correlation Summary
| Measurement | Immigrants from Honduras | Shoshone |
| Minimum | 1.7% | 2.3% |
| Maximum | 23.7% | 31.8% |
| Range | 22.0% | 29.5% |
| Mean | 12.2% | 16.4% |
| Median | 12.1% | 15.3% |
| Interquartile 25% (IQ1) | 10.5% | 14.0% |
| Interquartile 75% (IQ3) | 14.0% | 21.2% |
| Interquartile Range (IQR) | 3.5% | 7.1% |
| Standard Deviation (Sample) | 4.1% | 5.4% |
| Standard Deviation (Population) | 4.1% | 5.3% |
Similar Demographics by Disability
Demographics Similar to Immigrants from Honduras by Disability
In terms of disability, the demographic groups most similar to Immigrants from Honduras are Immigrants from Oceania (11.8%, a difference of 0.17%), Immigrants from Armenia (11.7%, a difference of 0.19%), Icelander (11.8%, a difference of 0.19%), Honduran (11.8%, a difference of 0.32%), and Greek (11.7%, a difference of 0.38%).
| Demographics | Rating | Rank | Disability |
| Maltese | 50.6 /100 | #173 | Average 11.7% |
| Albanians | 50.0 /100 | #174 | Average 11.7% |
| Haitians | 48.6 /100 | #175 | Average 11.7% |
| Immigrants | Western Africa | 47.5 /100 | #176 | Average 11.7% |
| Immigrants | Central America | 46.6 /100 | #177 | Average 11.7% |
| Greeks | 46.2 /100 | #178 | Average 11.7% |
| Immigrants | Armenia | 41.9 /100 | #179 | Average 11.7% |
| Immigrants | Honduras | 37.8 /100 | #180 | Fair 11.8% |
| Immigrants | Oceania | 34.3 /100 | #181 | Fair 11.8% |
| Icelanders | 34.0 /100 | #182 | Fair 11.8% |
| Hondurans | 31.2 /100 | #183 | Fair 11.8% |
| Iraqis | 30.0 /100 | #184 | Fair 11.8% |
| Immigrants | Burma/Myanmar | 28.5 /100 | #185 | Fair 11.8% |
| Immigrants | Scotland | 28.2 /100 | #186 | Fair 11.8% |
| Lebanese | 27.9 /100 | #187 | Fair 11.8% |
Demographics Similar to Shoshone by Disability
In terms of disability, the demographic groups most similar to Shoshone are Cape Verdean (13.5%, a difference of 0.050%), French American Indian (13.5%, a difference of 0.090%), Tlingit-Haida (13.5%, a difference of 0.18%), French Canadian (13.4%, a difference of 0.66%), and Blackfeet (13.6%, a difference of 0.71%).
| Demographics | Rating | Rank | Disability |
| Pennsylvania Germans | 0.0 /100 | #300 | Tragic 13.2% |
| Immigrants | Micronesia | 0.0 /100 | #301 | Tragic 13.2% |
| Arapaho | 0.0 /100 | #302 | Tragic 13.2% |
| Scotch-Irish | 0.0 /100 | #303 | Tragic 13.3% |
| Yakama | 0.0 /100 | #304 | Tragic 13.4% |
| French Canadians | 0.0 /100 | #305 | Tragic 13.4% |
| Cape Verdeans | 0.0 /100 | #306 | Tragic 13.5% |
| Shoshone | 0.0 /100 | #307 | Tragic 13.5% |
| French American Indians | 0.0 /100 | #308 | Tragic 13.5% |
| Tlingit-Haida | 0.0 /100 | #309 | Tragic 13.5% |
| Blackfeet | 0.0 /100 | #310 | Tragic 13.6% |
| Delaware | 0.0 /100 | #311 | Tragic 13.6% |
| Spanish Americans | 0.0 /100 | #312 | Tragic 13.6% |
| Cree | 0.0 /100 | #313 | Tragic 13.7% |
| Blacks/African Americans | 0.0 /100 | #314 | Tragic 13.7% |