Immigrants from Ghana vs Shoshone Disability
COMPARE
Immigrants from Ghana
Shoshone
Disability
Disability Comparison
Immigrants from Ghana
Shoshone
11.6%
DISABILITY
71.2/ 100
METRIC RATING
153rd/ 347
METRIC RANK
13.5%
DISABILITY
0.0/ 100
METRIC RATING
307th/ 347
METRIC RANK
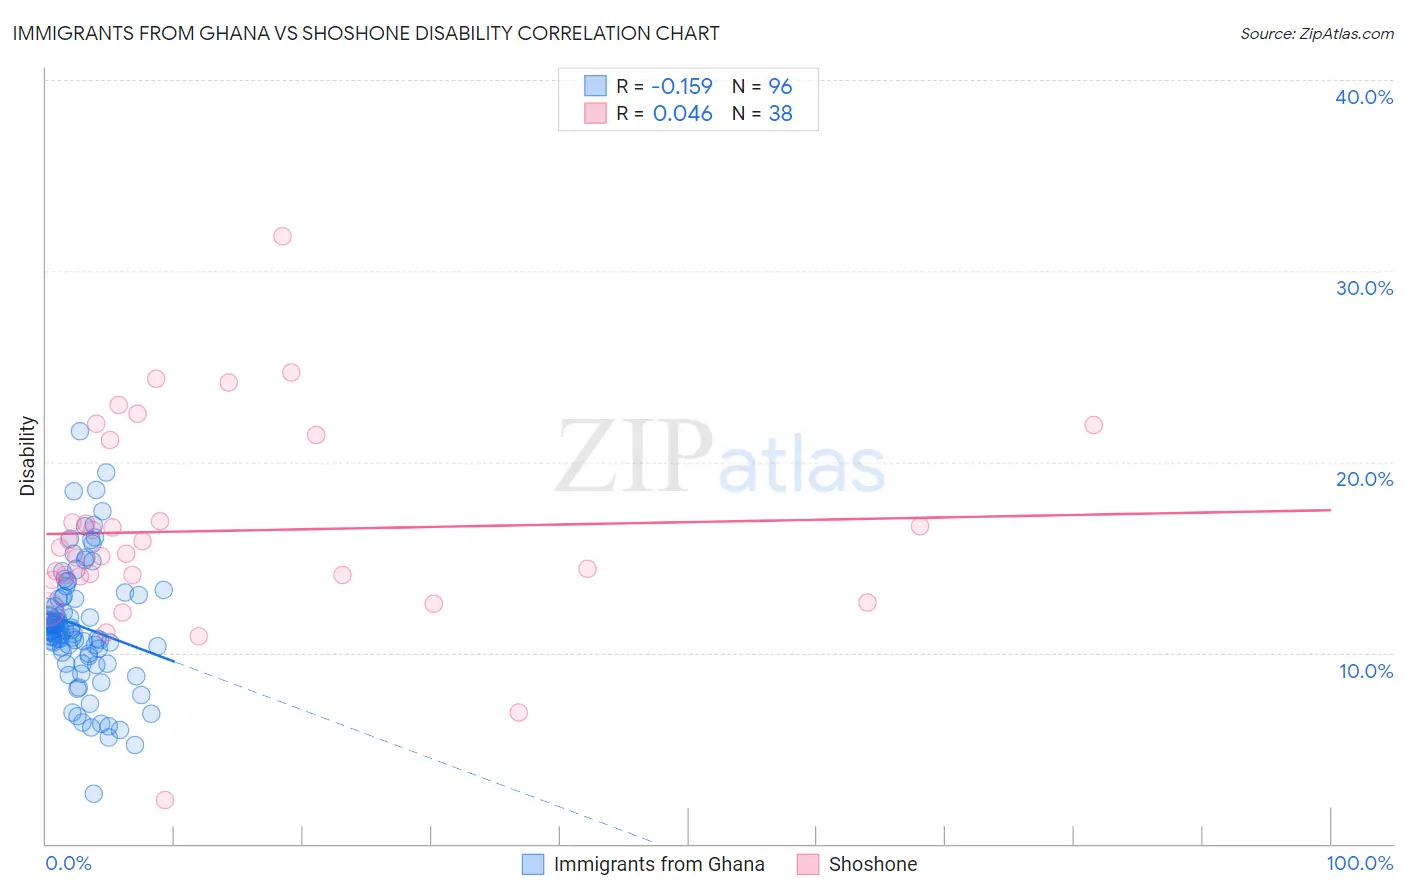
Immigrants from Ghana vs Shoshone Disability Correlation Chart
The statistical analysis conducted on geographies consisting of 199,930,208 people shows a poor negative correlation between the proportion of Immigrants from Ghana and percentage of population with a disability in the United States with a correlation coefficient (R) of -0.159 and weighted average of 11.6%. Similarly, the statistical analysis conducted on geographies consisting of 66,619,944 people shows no correlation between the proportion of Shoshone and percentage of population with a disability in the United States with a correlation coefficient (R) of 0.046 and weighted average of 13.5%, a difference of 16.7%.
Disability Correlation Summary
| Measurement | Immigrants from Ghana | Shoshone |
| Minimum | 2.6% | 2.3% |
| Maximum | 21.6% | 31.8% |
| Range | 19.0% | 29.5% |
| Mean | 11.4% | 16.4% |
| Median | 11.2% | 15.3% |
| Interquartile 25% (IQ1) | 9.9% | 14.0% |
| Interquartile 75% (IQ3) | 13.0% | 21.2% |
| Interquartile Range (IQR) | 3.1% | 7.1% |
| Standard Deviation (Sample) | 3.3% | 5.4% |
| Standard Deviation (Population) | 3.3% | 5.3% |
Similar Demographics by Disability
Demographics Similar to Immigrants from Ghana by Disability
In terms of disability, the demographic groups most similar to Immigrants from Ghana are Immigrants from Guatemala (11.6%, a difference of 0.0%), Immigrants from Kenya (11.6%, a difference of 0.050%), Immigrants from Moldova (11.6%, a difference of 0.050%), Romanian (11.6%, a difference of 0.080%), and Immigrants from Netherlands (11.6%, a difference of 0.080%).
| Demographics | Rating | Rank | Disability |
| Immigrants | Hungary | 79.0 /100 | #146 | Good 11.5% |
| Immigrants | Ukraine | 77.6 /100 | #147 | Good 11.5% |
| Sudanese | 77.1 /100 | #148 | Good 11.5% |
| Immigrants | Norway | 73.2 /100 | #149 | Good 11.6% |
| Romanians | 72.7 /100 | #150 | Good 11.6% |
| Immigrants | Kenya | 72.1 /100 | #151 | Good 11.6% |
| Immigrants | Moldova | 72.0 /100 | #152 | Good 11.6% |
| Immigrants | Ghana | 71.2 /100 | #153 | Good 11.6% |
| Immigrants | Guatemala | 71.1 /100 | #154 | Good 11.6% |
| Immigrants | Netherlands | 69.8 /100 | #155 | Good 11.6% |
| Immigrants | Fiji | 69.5 /100 | #156 | Good 11.6% |
| Immigrants | Middle Africa | 69.5 /100 | #157 | Good 11.6% |
| Armenians | 65.9 /100 | #158 | Good 11.6% |
| Guatemalans | 65.1 /100 | #159 | Good 11.6% |
| Immigrants | Barbados | 64.2 /100 | #160 | Good 11.6% |
Demographics Similar to Shoshone by Disability
In terms of disability, the demographic groups most similar to Shoshone are Cape Verdean (13.5%, a difference of 0.050%), French American Indian (13.5%, a difference of 0.090%), Tlingit-Haida (13.5%, a difference of 0.18%), French Canadian (13.4%, a difference of 0.66%), and Blackfeet (13.6%, a difference of 0.71%).
| Demographics | Rating | Rank | Disability |
| Pennsylvania Germans | 0.0 /100 | #300 | Tragic 13.2% |
| Immigrants | Micronesia | 0.0 /100 | #301 | Tragic 13.2% |
| Arapaho | 0.0 /100 | #302 | Tragic 13.2% |
| Scotch-Irish | 0.0 /100 | #303 | Tragic 13.3% |
| Yakama | 0.0 /100 | #304 | Tragic 13.4% |
| French Canadians | 0.0 /100 | #305 | Tragic 13.4% |
| Cape Verdeans | 0.0 /100 | #306 | Tragic 13.5% |
| Shoshone | 0.0 /100 | #307 | Tragic 13.5% |
| French American Indians | 0.0 /100 | #308 | Tragic 13.5% |
| Tlingit-Haida | 0.0 /100 | #309 | Tragic 13.5% |
| Blackfeet | 0.0 /100 | #310 | Tragic 13.6% |
| Delaware | 0.0 /100 | #311 | Tragic 13.6% |
| Spanish Americans | 0.0 /100 | #312 | Tragic 13.6% |
| Cree | 0.0 /100 | #313 | Tragic 13.7% |
| Blacks/African Americans | 0.0 /100 | #314 | Tragic 13.7% |