Cajun vs Shoshone Disability
COMPARE
Cajun
Shoshone
Disability
Disability Comparison
Cajuns
Shoshone
14.6%
DISABILITY
0.0/ 100
METRIC RATING
333rd/ 347
METRIC RANK
13.5%
DISABILITY
0.0/ 100
METRIC RATING
307th/ 347
METRIC RANK
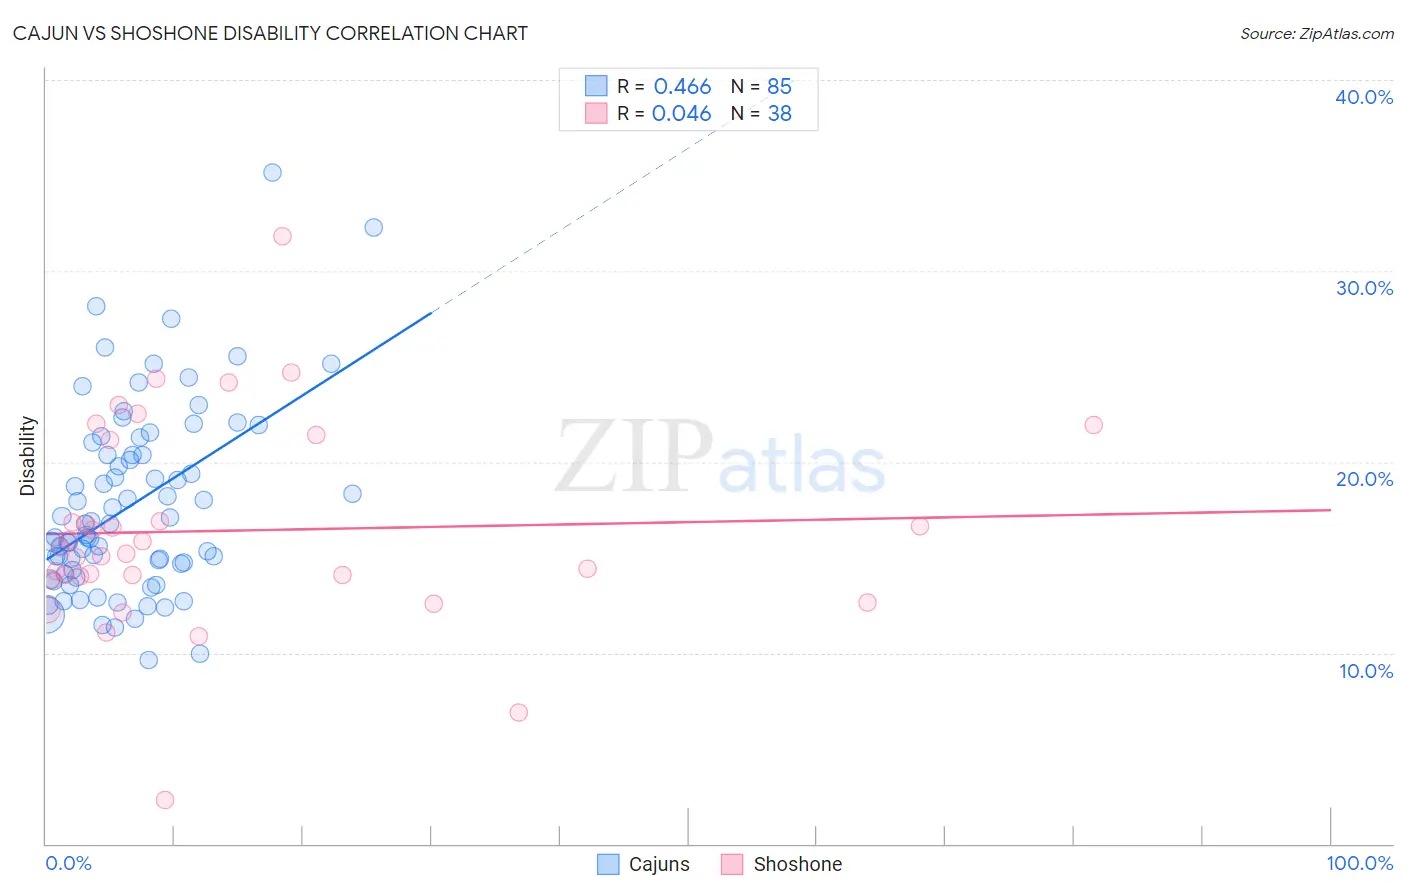
Cajun vs Shoshone Disability Correlation Chart
The statistical analysis conducted on geographies consisting of 149,702,868 people shows a moderate positive correlation between the proportion of Cajuns and percentage of population with a disability in the United States with a correlation coefficient (R) of 0.466 and weighted average of 14.6%. Similarly, the statistical analysis conducted on geographies consisting of 66,619,944 people shows no correlation between the proportion of Shoshone and percentage of population with a disability in the United States with a correlation coefficient (R) of 0.046 and weighted average of 13.5%, a difference of 8.0%.
Disability Correlation Summary
| Measurement | Cajun | Shoshone |
| Minimum | 9.6% | 2.3% |
| Maximum | 35.2% | 31.8% |
| Range | 25.5% | 29.5% |
| Mean | 17.8% | 16.4% |
| Median | 16.7% | 15.3% |
| Interquartile 25% (IQ1) | 14.3% | 14.0% |
| Interquartile 75% (IQ3) | 20.7% | 21.2% |
| Interquartile Range (IQR) | 6.5% | 7.1% |
| Standard Deviation (Sample) | 4.9% | 5.4% |
| Standard Deviation (Population) | 4.9% | 5.3% |
Similar Demographics by Disability
Demographics Similar to Cajuns by Disability
In terms of disability, the demographic groups most similar to Cajuns are Yuman (14.6%, a difference of 0.12%), Pueblo (14.4%, a difference of 1.1%), Alaskan Athabascan (14.4%, a difference of 1.1%), Tohono O'odham (14.8%, a difference of 1.2%), and Cherokee (14.8%, a difference of 1.7%).
| Demographics | Rating | Rank | Disability |
| Osage | 0.0 /100 | #326 | Tragic 14.2% |
| Ottawa | 0.0 /100 | #327 | Tragic 14.2% |
| Immigrants | Azores | 0.0 /100 | #328 | Tragic 14.2% |
| Potawatomi | 0.0 /100 | #329 | Tragic 14.2% |
| Navajo | 0.0 /100 | #330 | Tragic 14.3% |
| Alaskan Athabascans | 0.0 /100 | #331 | Tragic 14.4% |
| Pueblo | 0.0 /100 | #332 | Tragic 14.4% |
| Cajuns | 0.0 /100 | #333 | Tragic 14.6% |
| Yuman | 0.0 /100 | #334 | Tragic 14.6% |
| Tohono O'odham | 0.0 /100 | #335 | Tragic 14.8% |
| Cherokee | 0.0 /100 | #336 | Tragic 14.8% |
| Seminole | 0.0 /100 | #337 | Tragic 14.9% |
| Dutch West Indians | 0.0 /100 | #338 | Tragic 14.9% |
| Chickasaw | 0.0 /100 | #339 | Tragic 15.2% |
| Choctaw | 0.0 /100 | #340 | Tragic 15.4% |
Demographics Similar to Shoshone by Disability
In terms of disability, the demographic groups most similar to Shoshone are Cape Verdean (13.5%, a difference of 0.050%), French American Indian (13.5%, a difference of 0.090%), Tlingit-Haida (13.5%, a difference of 0.18%), French Canadian (13.4%, a difference of 0.66%), and Blackfeet (13.6%, a difference of 0.71%).
| Demographics | Rating | Rank | Disability |
| Pennsylvania Germans | 0.0 /100 | #300 | Tragic 13.2% |
| Immigrants | Micronesia | 0.0 /100 | #301 | Tragic 13.2% |
| Arapaho | 0.0 /100 | #302 | Tragic 13.2% |
| Scotch-Irish | 0.0 /100 | #303 | Tragic 13.3% |
| Yakama | 0.0 /100 | #304 | Tragic 13.4% |
| French Canadians | 0.0 /100 | #305 | Tragic 13.4% |
| Cape Verdeans | 0.0 /100 | #306 | Tragic 13.5% |
| Shoshone | 0.0 /100 | #307 | Tragic 13.5% |
| French American Indians | 0.0 /100 | #308 | Tragic 13.5% |
| Tlingit-Haida | 0.0 /100 | #309 | Tragic 13.5% |
| Blackfeet | 0.0 /100 | #310 | Tragic 13.6% |
| Delaware | 0.0 /100 | #311 | Tragic 13.6% |
| Spanish Americans | 0.0 /100 | #312 | Tragic 13.6% |
| Cree | 0.0 /100 | #313 | Tragic 13.7% |
| Blacks/African Americans | 0.0 /100 | #314 | Tragic 13.7% |