Sioux vs Immigrants from Ethiopia Disability
COMPARE
Sioux
Immigrants from Ethiopia
Disability
Disability Comparison
Sioux
Immigrants from Ethiopia
12.8%
DISABILITY
0.0/ 100
METRIC RATING
275th/ 347
METRIC RANK
10.7%
DISABILITY
100.0/ 100
METRIC RATING
34th/ 347
METRIC RANK
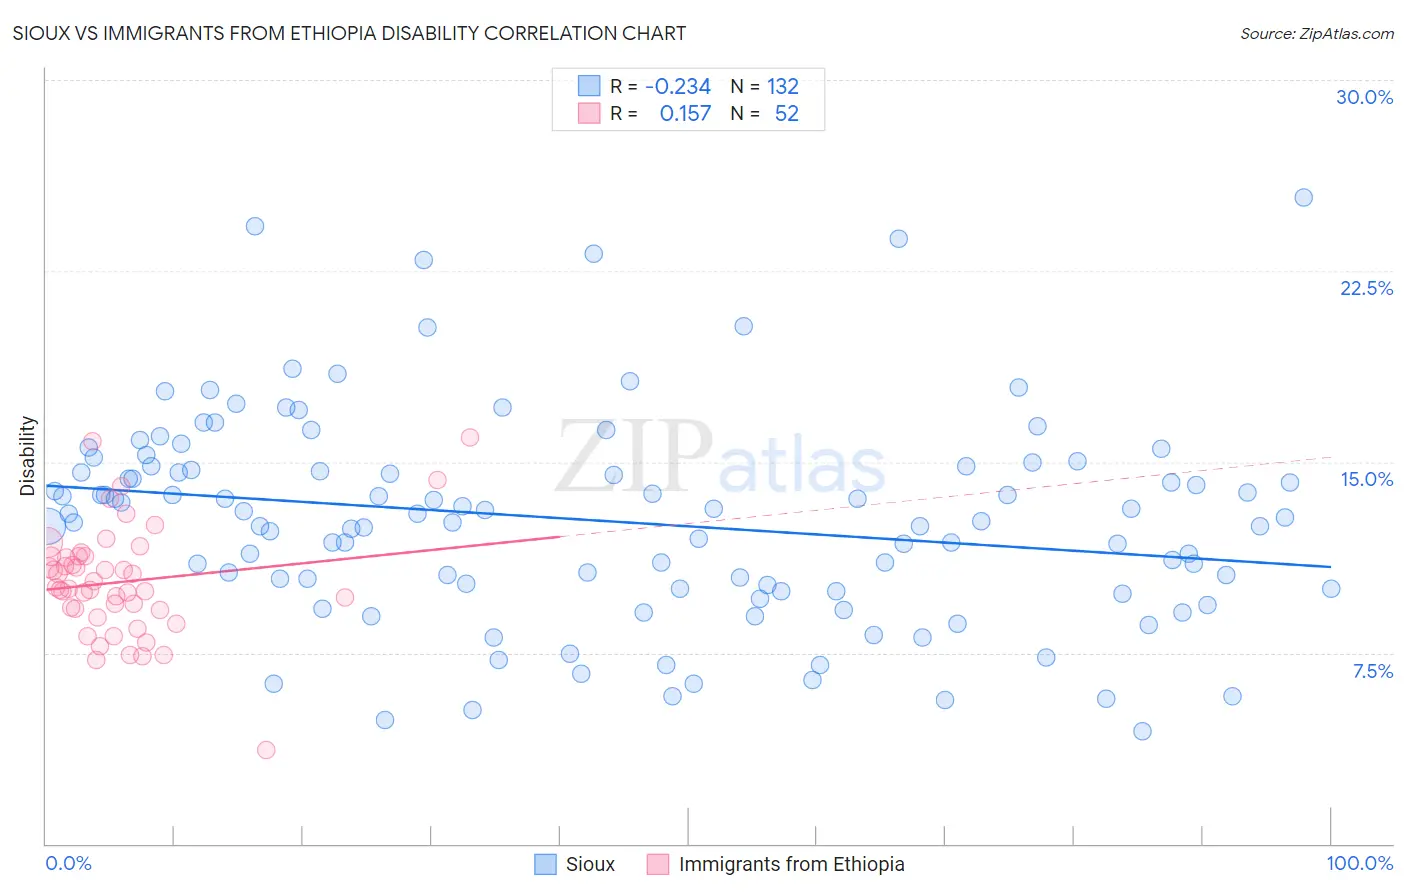
Sioux vs Immigrants from Ethiopia Disability Correlation Chart
The statistical analysis conducted on geographies consisting of 234,155,753 people shows a weak negative correlation between the proportion of Sioux and percentage of population with a disability in the United States with a correlation coefficient (R) of -0.234 and weighted average of 12.8%. Similarly, the statistical analysis conducted on geographies consisting of 211,552,130 people shows a poor positive correlation between the proportion of Immigrants from Ethiopia and percentage of population with a disability in the United States with a correlation coefficient (R) of 0.157 and weighted average of 10.7%, a difference of 19.4%.
Disability Correlation Summary
| Measurement | Sioux | Immigrants from Ethiopia |
| Minimum | 4.4% | 3.7% |
| Maximum | 25.4% | 15.9% |
| Range | 21.0% | 12.3% |
| Mean | 12.7% | 10.3% |
| Median | 12.7% | 10.0% |
| Interquartile 25% (IQ1) | 10.0% | 9.2% |
| Interquartile 75% (IQ3) | 14.8% | 11.3% |
| Interquartile Range (IQR) | 4.7% | 2.1% |
| Standard Deviation (Sample) | 4.1% | 2.2% |
| Standard Deviation (Population) | 4.1% | 2.2% |
Similar Demographics by Disability
Demographics Similar to Sioux by Disability
In terms of disability, the demographic groups most similar to Sioux are Nepalese (12.8%, a difference of 0.080%), Hmong (12.8%, a difference of 0.15%), Dutch (12.8%, a difference of 0.20%), German (12.8%, a difference of 0.37%), and Fijian (12.8%, a difference of 0.46%).
| Demographics | Rating | Rank | Disability |
| Bangladeshis | 0.1 /100 | #268 | Tragic 12.6% |
| Immigrants | Dominican Republic | 0.1 /100 | #269 | Tragic 12.6% |
| Portuguese | 0.1 /100 | #270 | Tragic 12.6% |
| Immigrants | Yemen | 0.1 /100 | #271 | Tragic 12.6% |
| Dominicans | 0.0 /100 | #272 | Tragic 12.7% |
| Finns | 0.0 /100 | #273 | Tragic 12.7% |
| Nepalese | 0.0 /100 | #274 | Tragic 12.8% |
| Sioux | 0.0 /100 | #275 | Tragic 12.8% |
| Hmong | 0.0 /100 | #276 | Tragic 12.8% |
| Dutch | 0.0 /100 | #277 | Tragic 12.8% |
| Germans | 0.0 /100 | #278 | Tragic 12.8% |
| Fijians | 0.0 /100 | #279 | Tragic 12.8% |
| Spanish | 0.0 /100 | #280 | Tragic 12.8% |
| Immigrants | Portugal | 0.0 /100 | #281 | Tragic 12.9% |
| Scottish | 0.0 /100 | #282 | Tragic 12.9% |
Demographics Similar to Immigrants from Ethiopia by Disability
In terms of disability, the demographic groups most similar to Immigrants from Ethiopia are Immigrants from Indonesia (10.7%, a difference of 0.010%), Ethiopian (10.7%, a difference of 0.070%), Turkish (10.7%, a difference of 0.080%), Immigrants from Kuwait (10.7%, a difference of 0.22%), and Paraguayan (10.6%, a difference of 0.47%).
| Demographics | Rating | Rank | Disability |
| Cypriots | 100.0 /100 | #27 | Exceptional 10.6% |
| Egyptians | 100.0 /100 | #28 | Exceptional 10.6% |
| Immigrants | Argentina | 100.0 /100 | #29 | Exceptional 10.6% |
| Immigrants | Turkey | 100.0 /100 | #30 | Exceptional 10.6% |
| Immigrants | Egypt | 100.0 /100 | #31 | Exceptional 10.6% |
| Paraguayans | 100.0 /100 | #32 | Exceptional 10.6% |
| Immigrants | Kuwait | 100.0 /100 | #33 | Exceptional 10.7% |
| Immigrants | Ethiopia | 100.0 /100 | #34 | Exceptional 10.7% |
| Immigrants | Indonesia | 100.0 /100 | #35 | Exceptional 10.7% |
| Ethiopians | 100.0 /100 | #36 | Exceptional 10.7% |
| Turks | 100.0 /100 | #37 | Exceptional 10.7% |
| Afghans | 99.9 /100 | #38 | Exceptional 10.8% |
| Cambodians | 99.9 /100 | #39 | Exceptional 10.8% |
| Mongolians | 99.9 /100 | #40 | Exceptional 10.8% |
| Immigrants | Australia | 99.9 /100 | #41 | Exceptional 10.8% |