Serbian vs Immigrants from Lithuania Self-Care Disability
COMPARE
Serbian
Immigrants from Lithuania
Self-Care Disability
Self-Care Disability Comparison
Serbians
Immigrants from Lithuania
2.4%
SELF-CARE DISABILITY
93.6/ 100
METRIC RATING
111th/ 347
METRIC RANK
2.3%
SELF-CARE DISABILITY
99.9/ 100
METRIC RATING
36th/ 347
METRIC RANK
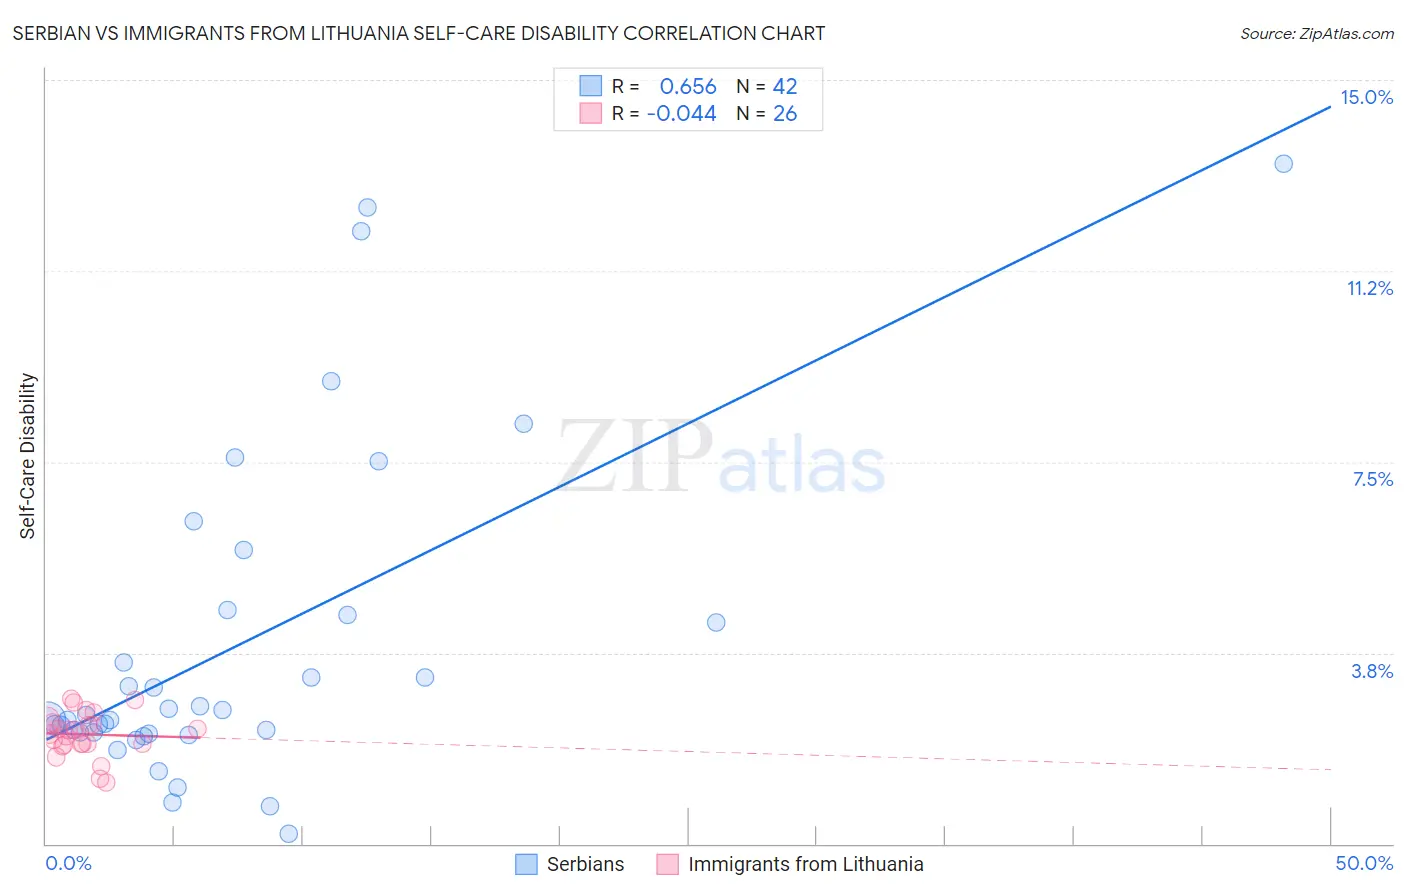
Serbian vs Immigrants from Lithuania Self-Care Disability Correlation Chart
The statistical analysis conducted on geographies consisting of 267,466,690 people shows a significant positive correlation between the proportion of Serbians and percentage of population with self-care disability in the United States with a correlation coefficient (R) of 0.656 and weighted average of 2.4%. Similarly, the statistical analysis conducted on geographies consisting of 117,698,570 people shows no correlation between the proportion of Immigrants from Lithuania and percentage of population with self-care disability in the United States with a correlation coefficient (R) of -0.044 and weighted average of 2.3%, a difference of 5.3%.
Self-Care Disability Correlation Summary
| Measurement | Serbian | Immigrants from Lithuania |
| Minimum | 0.20% | 1.2% |
| Maximum | 13.4% | 2.9% |
| Range | 13.2% | 1.7% |
| Mean | 3.9% | 2.1% |
| Median | 2.5% | 2.2% |
| Interquartile 25% (IQ1) | 2.2% | 2.0% |
| Interquartile 75% (IQ3) | 4.5% | 2.4% |
| Interquartile Range (IQR) | 2.3% | 0.43% |
| Standard Deviation (Sample) | 3.2% | 0.43% |
| Standard Deviation (Population) | 3.1% | 0.42% |
Similar Demographics by Self-Care Disability
Demographics Similar to Serbians by Self-Care Disability
In terms of self-care disability, the demographic groups most similar to Serbians are Immigrants from Africa (2.4%, a difference of 0.020%), Scandinavian (2.4%, a difference of 0.020%), South American (2.4%, a difference of 0.090%), Immigrants from North Macedonia (2.4%, a difference of 0.090%), and Immigrants from Hong Kong (2.4%, a difference of 0.090%).
| Demographics | Rating | Rank | Self-Care Disability |
| Bhutanese | 94.5 /100 | #104 | Exceptional 2.4% |
| Carpatho Rusyns | 94.4 /100 | #105 | Exceptional 2.4% |
| Immigrants | Indonesia | 94.3 /100 | #106 | Exceptional 2.4% |
| British | 94.3 /100 | #107 | Exceptional 2.4% |
| Greeks | 94.1 /100 | #108 | Exceptional 2.4% |
| Slovenes | 94.1 /100 | #109 | Exceptional 2.4% |
| Immigrants | Africa | 93.7 /100 | #110 | Exceptional 2.4% |
| Serbians | 93.6 /100 | #111 | Exceptional 2.4% |
| Scandinavians | 93.5 /100 | #112 | Exceptional 2.4% |
| South Americans | 93.2 /100 | #113 | Exceptional 2.4% |
| Immigrants | North Macedonia | 93.1 /100 | #114 | Exceptional 2.4% |
| Immigrants | Hong Kong | 93.1 /100 | #115 | Exceptional 2.4% |
| Northern Europeans | 92.9 /100 | #116 | Exceptional 2.4% |
| Taiwanese | 92.5 /100 | #117 | Exceptional 2.4% |
| Immigrants | Canada | 92.0 /100 | #118 | Exceptional 2.4% |
Demographics Similar to Immigrants from Lithuania by Self-Care Disability
In terms of self-care disability, the demographic groups most similar to Immigrants from Lithuania are Immigrants from Australia (2.3%, a difference of 0.010%), Immigrants from Turkey (2.3%, a difference of 0.070%), Immigrants from Korea (2.3%, a difference of 0.13%), Immigrants from Sweden (2.3%, a difference of 0.17%), and Immigrants from Eastern Africa (2.3%, a difference of 0.30%).
| Demographics | Rating | Rank | Self-Care Disability |
| Immigrants | Zimbabwe | 99.9 /100 | #29 | Exceptional 2.3% |
| Paraguayans | 99.9 /100 | #30 | Exceptional 2.3% |
| Danes | 99.9 /100 | #31 | Exceptional 2.3% |
| Burmese | 99.9 /100 | #32 | Exceptional 2.3% |
| Immigrants | Korea | 99.9 /100 | #33 | Exceptional 2.3% |
| Immigrants | Turkey | 99.9 /100 | #34 | Exceptional 2.3% |
| Immigrants | Australia | 99.9 /100 | #35 | Exceptional 2.3% |
| Immigrants | Lithuania | 99.9 /100 | #36 | Exceptional 2.3% |
| Immigrants | Sweden | 99.9 /100 | #37 | Exceptional 2.3% |
| Immigrants | Eastern Africa | 99.9 /100 | #38 | Exceptional 2.3% |
| Immigrants | Bulgaria | 99.8 /100 | #39 | Exceptional 2.3% |
| Iranians | 99.8 /100 | #40 | Exceptional 2.3% |
| Immigrants | Sudan | 99.8 /100 | #41 | Exceptional 2.3% |
| Immigrants | Uganda | 99.8 /100 | #42 | Exceptional 2.3% |
| Immigrants | Pakistan | 99.8 /100 | #43 | Exceptional 2.3% |