Serbian vs Immigrants from Lithuania Unemployment Among Ages 35 to 44 years
COMPARE
Serbian
Immigrants from Lithuania
Unemployment Among Ages 35 to 44 years
Unemployment Among Ages 35 to 44 years Comparison
Serbians
Immigrants from Lithuania
4.4%
UNEMPLOYMENT AMONG AGES 35 TO 44 YEARS
94.9/ 100
METRIC RATING
86th/ 347
METRIC RANK
4.4%
UNEMPLOYMENT AMONG AGES 35 TO 44 YEARS
96.7/ 100
METRIC RATING
71st/ 347
METRIC RANK
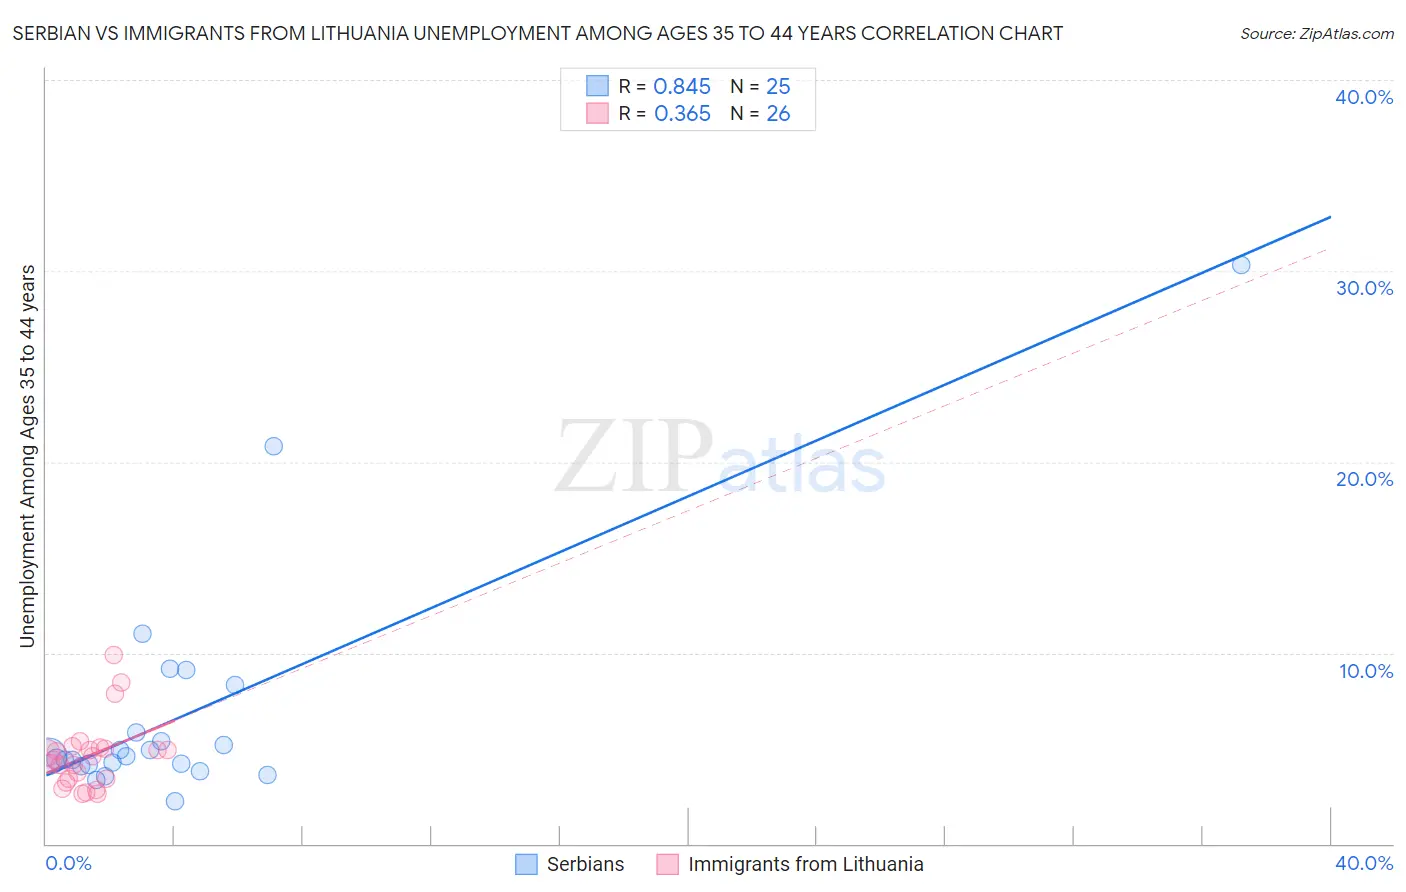
Serbian vs Immigrants from Lithuania Unemployment Among Ages 35 to 44 years Correlation Chart
The statistical analysis conducted on geographies consisting of 263,056,708 people shows a very strong positive correlation between the proportion of Serbians and unemployment rate among population between the ages 35 and 44 in the United States with a correlation coefficient (R) of 0.845 and weighted average of 4.4%. Similarly, the statistical analysis conducted on geographies consisting of 116,771,624 people shows a mild positive correlation between the proportion of Immigrants from Lithuania and unemployment rate among population between the ages 35 and 44 in the United States with a correlation coefficient (R) of 0.365 and weighted average of 4.4%, a difference of 0.85%.
Unemployment Among Ages 35 to 44 years Correlation Summary
| Measurement | Serbian | Immigrants from Lithuania |
| Minimum | 2.2% | 2.6% |
| Maximum | 30.3% | 9.9% |
| Range | 28.1% | 7.3% |
| Mean | 6.8% | 4.6% |
| Median | 4.6% | 4.5% |
| Interquartile 25% (IQ1) | 4.1% | 3.4% |
| Interquartile 75% (IQ3) | 7.1% | 5.0% |
| Interquartile Range (IQR) | 3.0% | 1.6% |
| Standard Deviation (Sample) | 6.2% | 1.8% |
| Standard Deviation (Population) | 6.0% | 1.7% |
Demographics Similar to Serbians and Immigrants from Lithuania by Unemployment Among Ages 35 to 44 years
In terms of unemployment among ages 35 to 44 years, the demographic groups most similar to Serbians are Immigrants from Bosnia and Herzegovina (4.4%, a difference of 0.030%), Immigrants from Kenya (4.4%, a difference of 0.040%), Immigrants from Latvia (4.4%, a difference of 0.050%), Immigrants from Chile (4.4%, a difference of 0.12%), and Immigrants from Australia (4.4%, a difference of 0.16%). Similarly, the demographic groups most similar to Immigrants from Lithuania are Slovene (4.4%, a difference of 0.0%), Immigrants from China (4.4%, a difference of 0.0%), Immigrants from Ireland (4.4%, a difference of 0.070%), Northern European (4.4%, a difference of 0.12%), and Lithuanian (4.4%, a difference of 0.15%).
| Demographics | Rating | Rank | Unemployment Among Ages 35 to 44 years |
| Immigrants | Ireland | 96.8 /100 | #68 | Exceptional 4.4% |
| Slovenes | 96.7 /100 | #69 | Exceptional 4.4% |
| Immigrants | China | 96.7 /100 | #70 | Exceptional 4.4% |
| Immigrants | Lithuania | 96.7 /100 | #71 | Exceptional 4.4% |
| Northern Europeans | 96.5 /100 | #72 | Exceptional 4.4% |
| Lithuanians | 96.5 /100 | #73 | Exceptional 4.4% |
| Poles | 96.4 /100 | #74 | Exceptional 4.4% |
| Immigrants | Romania | 96.3 /100 | #75 | Exceptional 4.4% |
| Immigrants | Jordan | 96.3 /100 | #76 | Exceptional 4.4% |
| Dutch | 96.1 /100 | #77 | Exceptional 4.4% |
| Indians (Asian) | 96.0 /100 | #78 | Exceptional 4.4% |
| Immigrants | Sweden | 95.9 /100 | #79 | Exceptional 4.4% |
| Kenyans | 95.7 /100 | #80 | Exceptional 4.4% |
| Immigrants | Scotland | 95.6 /100 | #81 | Exceptional 4.4% |
| Immigrants | Asia | 95.6 /100 | #82 | Exceptional 4.4% |
| Immigrants | Australia | 95.3 /100 | #83 | Exceptional 4.4% |
| Immigrants | Chile | 95.2 /100 | #84 | Exceptional 4.4% |
| Immigrants | Kenya | 95.0 /100 | #85 | Exceptional 4.4% |
| Serbians | 94.9 /100 | #86 | Exceptional 4.4% |
| Immigrants | Bosnia and Herzegovina | 94.8 /100 | #87 | Exceptional 4.4% |
| Immigrants | Latvia | 94.8 /100 | #88 | Exceptional 4.4% |