Serbian vs Russian Self-Care Disability
COMPARE
Serbian
Russian
Self-Care Disability
Self-Care Disability Comparison
Serbians
Russians
2.4%
SELF-CARE DISABILITY
93.6/ 100
METRIC RATING
111th/ 347
METRIC RANK
2.4%
SELF-CARE DISABILITY
88.2/ 100
METRIC RATING
134th/ 347
METRIC RANK
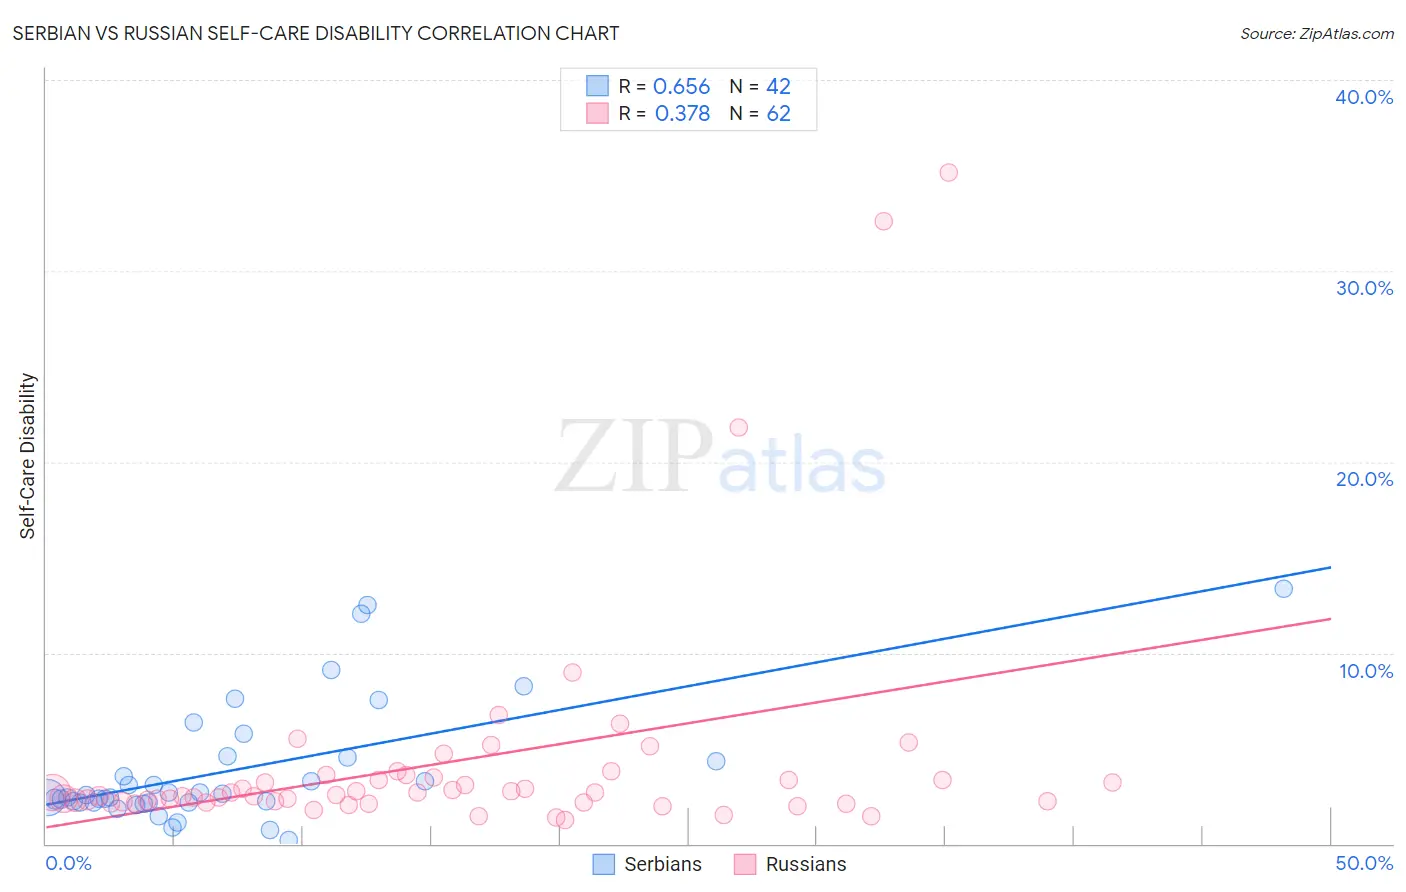
Serbian vs Russian Self-Care Disability Correlation Chart
The statistical analysis conducted on geographies consisting of 267,466,690 people shows a significant positive correlation between the proportion of Serbians and percentage of population with self-care disability in the United States with a correlation coefficient (R) of 0.656 and weighted average of 2.4%. Similarly, the statistical analysis conducted on geographies consisting of 510,848,138 people shows a mild positive correlation between the proportion of Russians and percentage of population with self-care disability in the United States with a correlation coefficient (R) of 0.378 and weighted average of 2.4%, a difference of 0.82%.
Self-Care Disability Correlation Summary
| Measurement | Serbian | Russian |
| Minimum | 0.20% | 1.2% |
| Maximum | 13.4% | 35.1% |
| Range | 13.2% | 33.9% |
| Mean | 3.9% | 4.3% |
| Median | 2.5% | 2.6% |
| Interquartile 25% (IQ1) | 2.2% | 2.2% |
| Interquartile 75% (IQ3) | 4.5% | 3.4% |
| Interquartile Range (IQR) | 2.3% | 1.2% |
| Standard Deviation (Sample) | 3.2% | 6.1% |
| Standard Deviation (Population) | 3.1% | 6.1% |
Similar Demographics by Self-Care Disability
Demographics Similar to Serbians by Self-Care Disability
In terms of self-care disability, the demographic groups most similar to Serbians are Immigrants from Africa (2.4%, a difference of 0.020%), Scandinavian (2.4%, a difference of 0.020%), South American (2.4%, a difference of 0.090%), Immigrants from North Macedonia (2.4%, a difference of 0.090%), and Immigrants from Hong Kong (2.4%, a difference of 0.090%).
| Demographics | Rating | Rank | Self-Care Disability |
| Bhutanese | 94.5 /100 | #104 | Exceptional 2.4% |
| Carpatho Rusyns | 94.4 /100 | #105 | Exceptional 2.4% |
| Immigrants | Indonesia | 94.3 /100 | #106 | Exceptional 2.4% |
| British | 94.3 /100 | #107 | Exceptional 2.4% |
| Greeks | 94.1 /100 | #108 | Exceptional 2.4% |
| Slovenes | 94.1 /100 | #109 | Exceptional 2.4% |
| Immigrants | Africa | 93.7 /100 | #110 | Exceptional 2.4% |
| Serbians | 93.6 /100 | #111 | Exceptional 2.4% |
| Scandinavians | 93.5 /100 | #112 | Exceptional 2.4% |
| South Americans | 93.2 /100 | #113 | Exceptional 2.4% |
| Immigrants | North Macedonia | 93.1 /100 | #114 | Exceptional 2.4% |
| Immigrants | Hong Kong | 93.1 /100 | #115 | Exceptional 2.4% |
| Northern Europeans | 92.9 /100 | #116 | Exceptional 2.4% |
| Taiwanese | 92.5 /100 | #117 | Exceptional 2.4% |
| Immigrants | Canada | 92.0 /100 | #118 | Exceptional 2.4% |
Demographics Similar to Russians by Self-Care Disability
In terms of self-care disability, the demographic groups most similar to Russians are Immigrants from Colombia (2.4%, a difference of 0.040%), Laotian (2.4%, a difference of 0.050%), Immigrants from South America (2.4%, a difference of 0.070%), Polish (2.4%, a difference of 0.080%), and Immigrants from Austria (2.4%, a difference of 0.10%).
| Demographics | Rating | Rank | Self-Care Disability |
| Colombians | 89.7 /100 | #127 | Excellent 2.4% |
| Immigrants | Hungary | 89.6 /100 | #128 | Excellent 2.4% |
| Immigrants | Romania | 89.3 /100 | #129 | Excellent 2.4% |
| Immigrants | Austria | 89.0 /100 | #130 | Excellent 2.4% |
| Poles | 88.9 /100 | #131 | Excellent 2.4% |
| Immigrants | South America | 88.8 /100 | #132 | Excellent 2.4% |
| Immigrants | Colombia | 88.5 /100 | #133 | Excellent 2.4% |
| Russians | 88.2 /100 | #134 | Excellent 2.4% |
| Laotians | 87.8 /100 | #135 | Excellent 2.4% |
| South American Indians | 87.2 /100 | #136 | Excellent 2.4% |
| Austrians | 87.0 /100 | #137 | Excellent 2.4% |
| Immigrants | Croatia | 86.6 /100 | #138 | Excellent 2.4% |
| Sri Lankans | 86.6 /100 | #139 | Excellent 2.4% |
| Immigrants | Uruguay | 85.4 /100 | #140 | Excellent 2.4% |
| Alaska Natives | 84.5 /100 | #141 | Excellent 2.4% |