Serbian vs Immigrants from Southern Europe Self-Care Disability
COMPARE
Serbian
Immigrants from Southern Europe
Self-Care Disability
Self-Care Disability Comparison
Serbians
Immigrants from Southern Europe
2.4%
SELF-CARE DISABILITY
93.6/ 100
METRIC RATING
111th/ 347
METRIC RANK
2.5%
SELF-CARE DISABILITY
15.6/ 100
METRIC RATING
195th/ 347
METRIC RANK
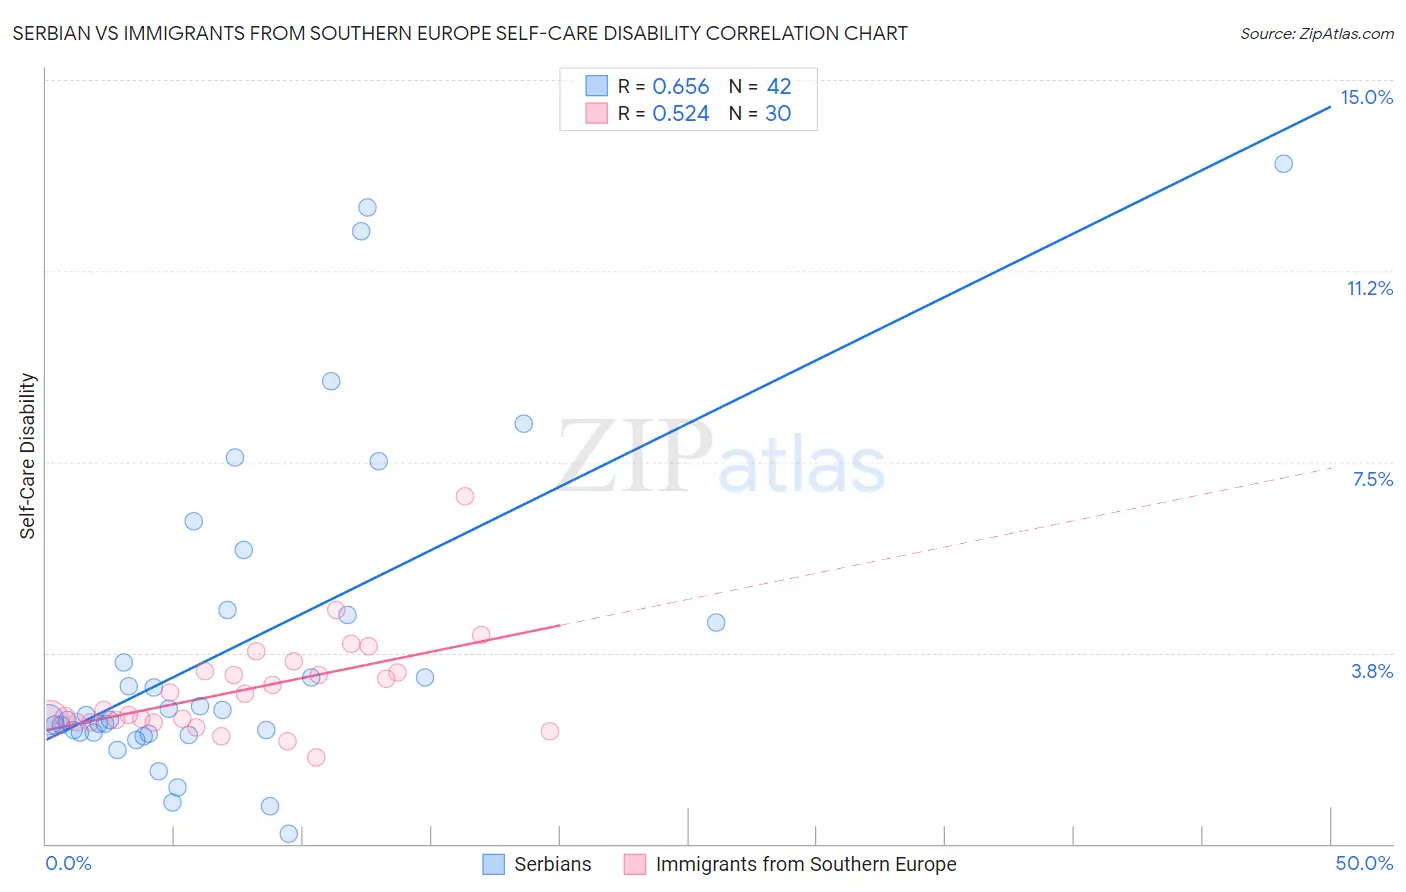
Serbian vs Immigrants from Southern Europe Self-Care Disability Correlation Chart
The statistical analysis conducted on geographies consisting of 267,466,690 people shows a significant positive correlation between the proportion of Serbians and percentage of population with self-care disability in the United States with a correlation coefficient (R) of 0.656 and weighted average of 2.4%. Similarly, the statistical analysis conducted on geographies consisting of 402,329,644 people shows a substantial positive correlation between the proportion of Immigrants from Southern Europe and percentage of population with self-care disability in the United States with a correlation coefficient (R) of 0.524 and weighted average of 2.5%, a difference of 5.4%.
Self-Care Disability Correlation Summary
| Measurement | Serbian | Immigrants from Southern Europe |
| Minimum | 0.20% | 1.7% |
| Maximum | 13.4% | 6.8% |
| Range | 13.2% | 5.1% |
| Mean | 3.9% | 3.0% |
| Median | 2.5% | 2.8% |
| Interquartile 25% (IQ1) | 2.2% | 2.4% |
| Interquartile 75% (IQ3) | 4.5% | 3.4% |
| Interquartile Range (IQR) | 2.3% | 1.00% |
| Standard Deviation (Sample) | 3.2% | 1.00% |
| Standard Deviation (Population) | 3.1% | 0.98% |
Similar Demographics by Self-Care Disability
Demographics Similar to Serbians by Self-Care Disability
In terms of self-care disability, the demographic groups most similar to Serbians are Immigrants from Africa (2.4%, a difference of 0.020%), Scandinavian (2.4%, a difference of 0.020%), South American (2.4%, a difference of 0.090%), Immigrants from North Macedonia (2.4%, a difference of 0.090%), and Immigrants from Hong Kong (2.4%, a difference of 0.090%).
| Demographics | Rating | Rank | Self-Care Disability |
| Bhutanese | 94.5 /100 | #104 | Exceptional 2.4% |
| Carpatho Rusyns | 94.4 /100 | #105 | Exceptional 2.4% |
| Immigrants | Indonesia | 94.3 /100 | #106 | Exceptional 2.4% |
| British | 94.3 /100 | #107 | Exceptional 2.4% |
| Greeks | 94.1 /100 | #108 | Exceptional 2.4% |
| Slovenes | 94.1 /100 | #109 | Exceptional 2.4% |
| Immigrants | Africa | 93.7 /100 | #110 | Exceptional 2.4% |
| Serbians | 93.6 /100 | #111 | Exceptional 2.4% |
| Scandinavians | 93.5 /100 | #112 | Exceptional 2.4% |
| South Americans | 93.2 /100 | #113 | Exceptional 2.4% |
| Immigrants | North Macedonia | 93.1 /100 | #114 | Exceptional 2.4% |
| Immigrants | Hong Kong | 93.1 /100 | #115 | Exceptional 2.4% |
| Northern Europeans | 92.9 /100 | #116 | Exceptional 2.4% |
| Taiwanese | 92.5 /100 | #117 | Exceptional 2.4% |
| Immigrants | Canada | 92.0 /100 | #118 | Exceptional 2.4% |
Demographics Similar to Immigrants from Southern Europe by Self-Care Disability
In terms of self-care disability, the demographic groups most similar to Immigrants from Southern Europe are Korean (2.5%, a difference of 0.010%), Crow (2.5%, a difference of 0.030%), Immigrants (2.5%, a difference of 0.060%), Immigrants from Ghana (2.5%, a difference of 0.080%), and Immigrants from Germany (2.5%, a difference of 0.19%).
| Demographics | Rating | Rank | Self-Care Disability |
| Immigrants | Oceania | 28.3 /100 | #188 | Fair 2.5% |
| Immigrants | Eastern Europe | 28.0 /100 | #189 | Fair 2.5% |
| Sioux | 24.6 /100 | #190 | Fair 2.5% |
| Moroccans | 22.9 /100 | #191 | Fair 2.5% |
| Soviet Union | 22.2 /100 | #192 | Fair 2.5% |
| Ukrainians | 21.4 /100 | #193 | Fair 2.5% |
| Immigrants | Germany | 17.9 /100 | #194 | Poor 2.5% |
| Immigrants | Southern Europe | 15.6 /100 | #195 | Poor 2.5% |
| Koreans | 15.5 /100 | #196 | Poor 2.5% |
| Crow | 15.2 /100 | #197 | Poor 2.5% |
| Immigrants | Immigrants | 15.0 /100 | #198 | Poor 2.5% |
| Immigrants | Ghana | 14.7 /100 | #199 | Poor 2.5% |
| Immigrants | Western Africa | 13.3 /100 | #200 | Poor 2.5% |
| Immigrants | South Eastern Asia | 12.9 /100 | #201 | Poor 2.5% |
| Slovaks | 12.6 /100 | #202 | Poor 2.5% |