Serbian vs South African Self-Care Disability
COMPARE
Serbian
South African
Self-Care Disability
Self-Care Disability Comparison
Serbians
South Africans
2.4%
SELF-CARE DISABILITY
93.6/ 100
METRIC RATING
111th/ 347
METRIC RANK
2.3%
SELF-CARE DISABILITY
99.3/ 100
METRIC RATING
67th/ 347
METRIC RANK
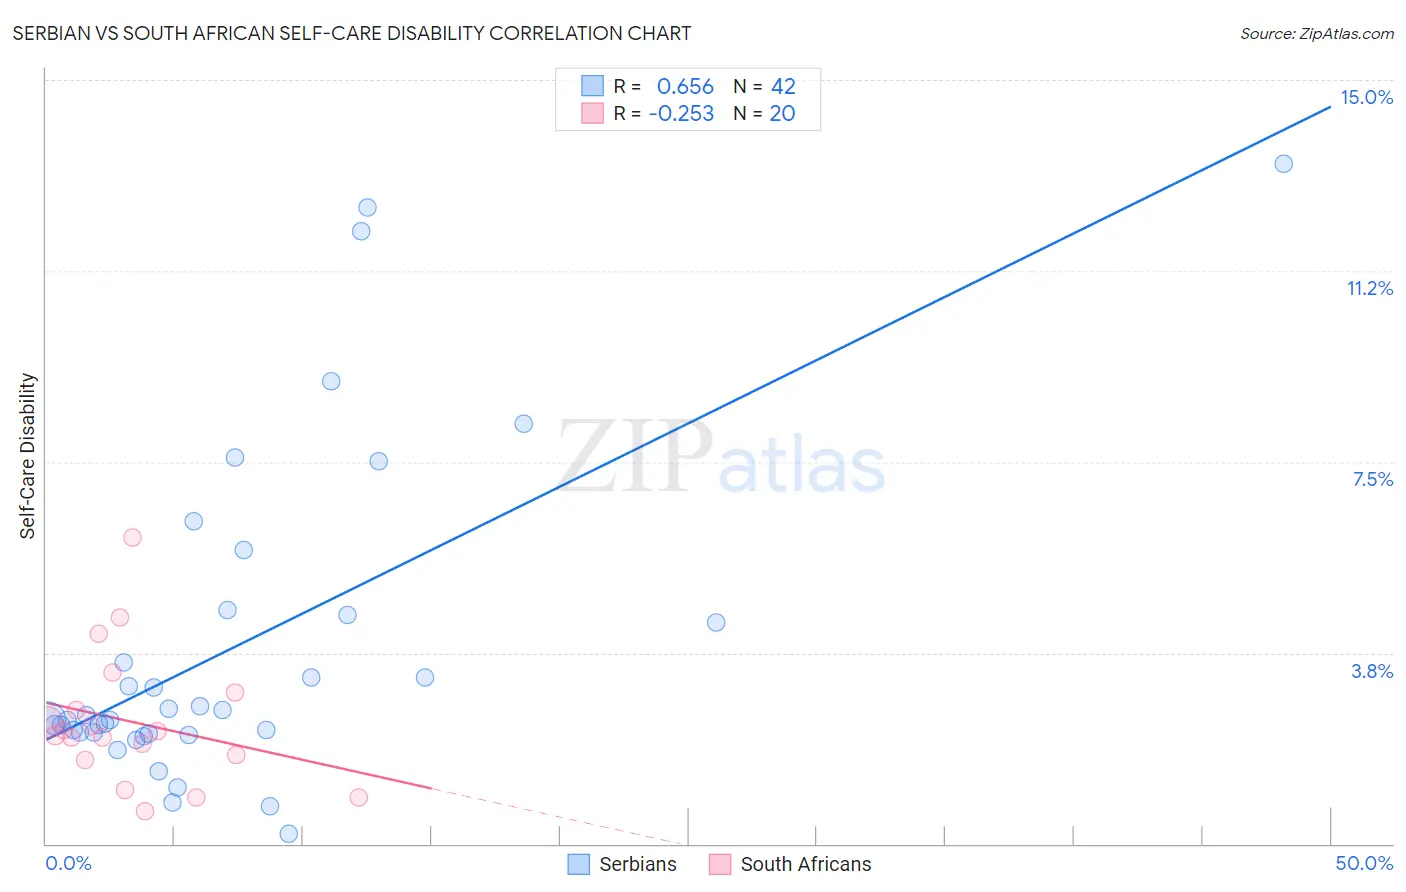
Serbian vs South African Self-Care Disability Correlation Chart
The statistical analysis conducted on geographies consisting of 267,466,690 people shows a significant positive correlation between the proportion of Serbians and percentage of population with self-care disability in the United States with a correlation coefficient (R) of 0.656 and weighted average of 2.4%. Similarly, the statistical analysis conducted on geographies consisting of 182,494,090 people shows a weak negative correlation between the proportion of South Africans and percentage of population with self-care disability in the United States with a correlation coefficient (R) of -0.253 and weighted average of 2.3%, a difference of 2.8%.
Self-Care Disability Correlation Summary
| Measurement | Serbian | South African |
| Minimum | 0.20% | 0.63% |
| Maximum | 13.4% | 6.0% |
| Range | 13.2% | 5.4% |
| Mean | 3.9% | 2.4% |
| Median | 2.5% | 2.2% |
| Interquartile 25% (IQ1) | 2.2% | 1.7% |
| Interquartile 75% (IQ3) | 4.5% | 2.8% |
| Interquartile Range (IQR) | 2.3% | 1.1% |
| Standard Deviation (Sample) | 3.2% | 1.3% |
| Standard Deviation (Population) | 3.1% | 1.3% |
Similar Demographics by Self-Care Disability
Demographics Similar to Serbians by Self-Care Disability
In terms of self-care disability, the demographic groups most similar to Serbians are Immigrants from Africa (2.4%, a difference of 0.020%), Scandinavian (2.4%, a difference of 0.020%), South American (2.4%, a difference of 0.090%), Immigrants from North Macedonia (2.4%, a difference of 0.090%), and Immigrants from Hong Kong (2.4%, a difference of 0.090%).
| Demographics | Rating | Rank | Self-Care Disability |
| Bhutanese | 94.5 /100 | #104 | Exceptional 2.4% |
| Carpatho Rusyns | 94.4 /100 | #105 | Exceptional 2.4% |
| Immigrants | Indonesia | 94.3 /100 | #106 | Exceptional 2.4% |
| British | 94.3 /100 | #107 | Exceptional 2.4% |
| Greeks | 94.1 /100 | #108 | Exceptional 2.4% |
| Slovenes | 94.1 /100 | #109 | Exceptional 2.4% |
| Immigrants | Africa | 93.7 /100 | #110 | Exceptional 2.4% |
| Serbians | 93.6 /100 | #111 | Exceptional 2.4% |
| Scandinavians | 93.5 /100 | #112 | Exceptional 2.4% |
| South Americans | 93.2 /100 | #113 | Exceptional 2.4% |
| Immigrants | North Macedonia | 93.1 /100 | #114 | Exceptional 2.4% |
| Immigrants | Hong Kong | 93.1 /100 | #115 | Exceptional 2.4% |
| Northern Europeans | 92.9 /100 | #116 | Exceptional 2.4% |
| Taiwanese | 92.5 /100 | #117 | Exceptional 2.4% |
| Immigrants | Canada | 92.0 /100 | #118 | Exceptional 2.4% |
Demographics Similar to South Africans by Self-Care Disability
In terms of self-care disability, the demographic groups most similar to South Africans are Immigrants from Argentina (2.3%, a difference of 0.030%), Brazilian (2.3%, a difference of 0.060%), Immigrants from Zaire (2.3%, a difference of 0.090%), Immigrants from Norway (2.3%, a difference of 0.090%), and Swedish (2.3%, a difference of 0.12%).
| Demographics | Rating | Rank | Self-Care Disability |
| Immigrants | Japan | 99.5 /100 | #60 | Exceptional 2.3% |
| Palestinians | 99.4 /100 | #61 | Exceptional 2.3% |
| Egyptians | 99.4 /100 | #62 | Exceptional 2.3% |
| Mongolians | 99.3 /100 | #63 | Exceptional 2.3% |
| Swedes | 99.3 /100 | #64 | Exceptional 2.3% |
| Brazilians | 99.3 /100 | #65 | Exceptional 2.3% |
| Immigrants | Argentina | 99.3 /100 | #66 | Exceptional 2.3% |
| South Africans | 99.3 /100 | #67 | Exceptional 2.3% |
| Immigrants | Zaire | 99.2 /100 | #68 | Exceptional 2.3% |
| Immigrants | Norway | 99.2 /100 | #69 | Exceptional 2.3% |
| Immigrants | Northern Europe | 99.2 /100 | #70 | Exceptional 2.3% |
| Asians | 99.2 /100 | #71 | Exceptional 2.3% |
| Eastern Europeans | 99.2 /100 | #72 | Exceptional 2.3% |
| Immigrants | Egypt | 99.1 /100 | #73 | Exceptional 2.3% |
| Immigrants | Switzerland | 99.1 /100 | #74 | Exceptional 2.3% |