Scotch-Irish vs Paraguayan Seniors Poverty Over the Age of 65
COMPARE
Scotch-Irish
Paraguayan
Seniors Poverty Over the Age of 65
Seniors Poverty Over the Age of 65 Comparison
Scotch-Irish
Paraguayans
9.5%
SENIORS POVERTY OVER THE AGE OF 65
99.7/ 100
METRIC RATING
37th/ 347
METRIC RANK
11.4%
SENIORS POVERTY OVER THE AGE OF 65
11.3/ 100
METRIC RATING
209th/ 347
METRIC RANK
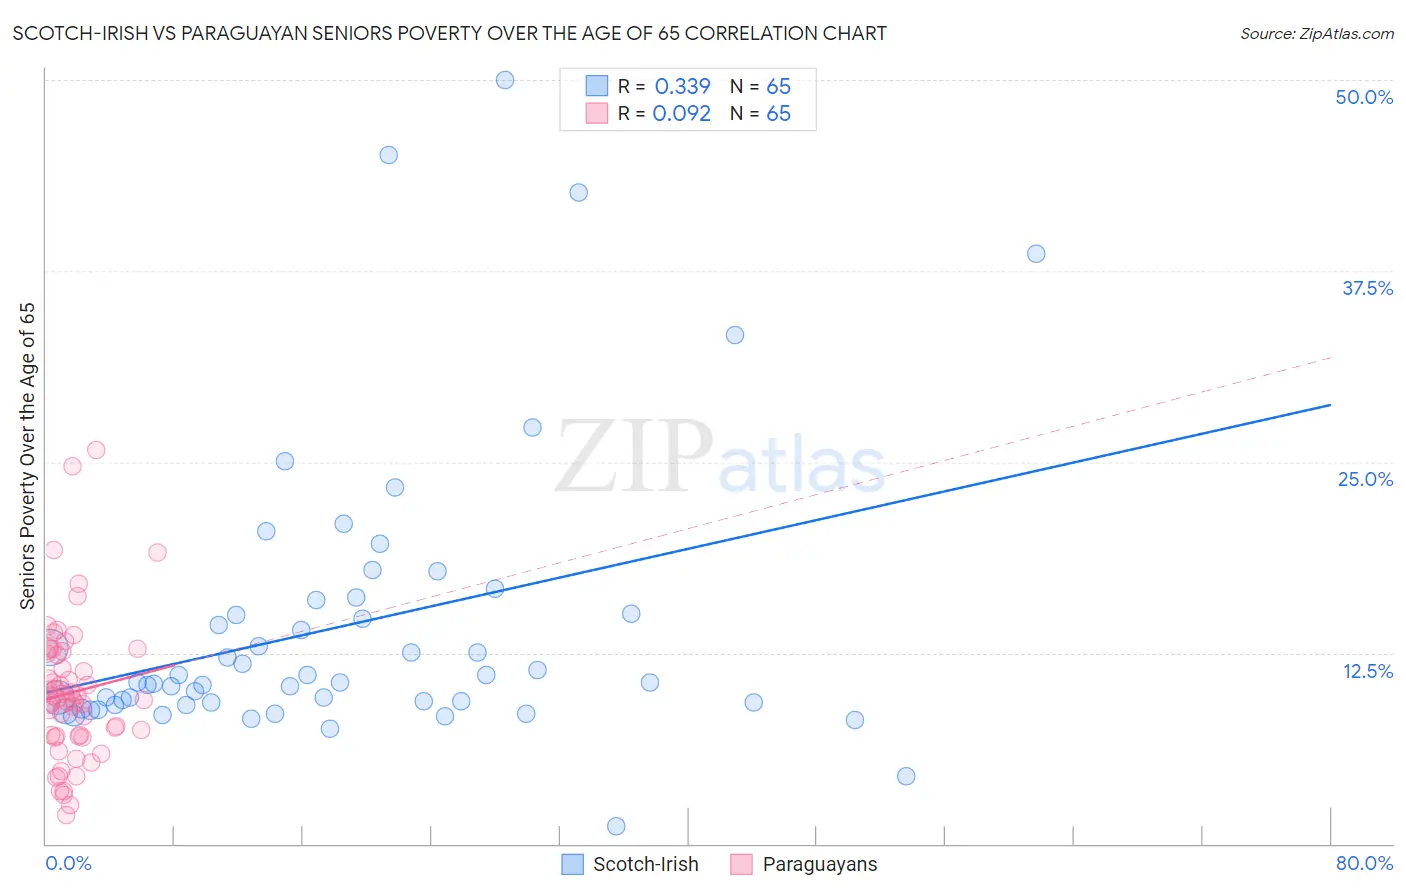
Scotch-Irish vs Paraguayan Seniors Poverty Over the Age of 65 Correlation Chart
The statistical analysis conducted on geographies consisting of 544,466,236 people shows a mild positive correlation between the proportion of Scotch-Irish and poverty level among seniors over the age of 65 in the United States with a correlation coefficient (R) of 0.339 and weighted average of 9.5%. Similarly, the statistical analysis conducted on geographies consisting of 95,049,863 people shows a slight positive correlation between the proportion of Paraguayans and poverty level among seniors over the age of 65 in the United States with a correlation coefficient (R) of 0.092 and weighted average of 11.4%, a difference of 20.3%.
Seniors Poverty Over the Age of 65 Correlation Summary
| Measurement | Scotch-Irish | Paraguayan |
| Minimum | 1.1% | 1.8% |
| Maximum | 50.0% | 25.8% |
| Range | 48.9% | 24.0% |
| Mean | 14.3% | 9.9% |
| Median | 10.5% | 9.5% |
| Interquartile 25% (IQ1) | 9.2% | 7.1% |
| Interquartile 75% (IQ3) | 15.5% | 12.5% |
| Interquartile Range (IQR) | 6.3% | 5.5% |
| Standard Deviation (Sample) | 9.4% | 4.6% |
| Standard Deviation (Population) | 9.3% | 4.6% |
Similar Demographics by Seniors Poverty Over the Age of 65
Demographics Similar to Scotch-Irish by Seniors Poverty Over the Age of 65
In terms of seniors poverty over the age of 65, the demographic groups most similar to Scotch-Irish are Belgian (9.5%, a difference of 0.020%), Czechoslovakian (9.5%, a difference of 0.50%), Latvian (9.5%, a difference of 0.55%), Greek (9.6%, a difference of 0.65%), and Assyrian/Chaldean/Syriac (9.6%, a difference of 0.77%).
| Demographics | Rating | Rank | Seniors Poverty Over the Age of 65 |
| Menominee | 99.8 /100 | #30 | Exceptional 9.4% |
| Finns | 99.8 /100 | #31 | Exceptional 9.4% |
| Northern Europeans | 99.8 /100 | #32 | Exceptional 9.4% |
| Native Hawaiians | 99.8 /100 | #33 | Exceptional 9.4% |
| British | 99.8 /100 | #34 | Exceptional 9.4% |
| Latvians | 99.8 /100 | #35 | Exceptional 9.5% |
| Czechoslovakians | 99.8 /100 | #36 | Exceptional 9.5% |
| Scotch-Irish | 99.7 /100 | #37 | Exceptional 9.5% |
| Belgians | 99.7 /100 | #38 | Exceptional 9.5% |
| Greeks | 99.6 /100 | #39 | Exceptional 9.6% |
| Assyrians/Chaldeans/Syriacs | 99.6 /100 | #40 | Exceptional 9.6% |
| Immigrants | North Macedonia | 99.6 /100 | #41 | Exceptional 9.6% |
| Zimbabweans | 99.6 /100 | #42 | Exceptional 9.6% |
| Eastern Europeans | 99.6 /100 | #43 | Exceptional 9.6% |
| Austrians | 99.5 /100 | #44 | Exceptional 9.6% |
Demographics Similar to Paraguayans by Seniors Poverty Over the Age of 65
In terms of seniors poverty over the age of 65, the demographic groups most similar to Paraguayans are Ugandan (11.4%, a difference of 0.020%), South American Indian (11.4%, a difference of 0.070%), Indonesian (11.5%, a difference of 0.21%), Immigrants from China (11.5%, a difference of 0.41%), and Immigrants from Western Asia (11.4%, a difference of 0.44%).
| Demographics | Rating | Rank | Seniors Poverty Over the Age of 65 |
| Costa Ricans | 17.0 /100 | #202 | Poor 11.3% |
| Immigrants | Zaire | 16.9 /100 | #203 | Poor 11.3% |
| Israelis | 16.5 /100 | #204 | Poor 11.3% |
| Brazilians | 15.4 /100 | #205 | Poor 11.3% |
| Choctaw | 14.5 /100 | #206 | Poor 11.4% |
| Immigrants | Western Asia | 13.6 /100 | #207 | Poor 11.4% |
| South American Indians | 11.7 /100 | #208 | Poor 11.4% |
| Paraguayans | 11.3 /100 | #209 | Poor 11.4% |
| Ugandans | 11.2 /100 | #210 | Poor 11.4% |
| Indonesians | 10.4 /100 | #211 | Poor 11.5% |
| Immigrants | China | 9.5 /100 | #212 | Tragic 11.5% |
| Nepalese | 8.9 /100 | #213 | Tragic 11.5% |
| Immigrants | Russia | 8.8 /100 | #214 | Tragic 11.5% |
| French American Indians | 8.7 /100 | #215 | Tragic 11.5% |
| Immigrants | Morocco | 6.8 /100 | #216 | Tragic 11.6% |