Asian vs Paraguayan Disability Age 18 to 34
COMPARE
Asian
Paraguayan
Disability Age 18 to 34
Disability Age 18 to 34 Comparison
Asians
Paraguayans
5.8%
DISABILITY AGE 18 TO 34
99.9/ 100
METRIC RATING
39th/ 347
METRIC RANK
5.9%
DISABILITY AGE 18 TO 34
99.7/ 100
METRIC RATING
56th/ 347
METRIC RANK
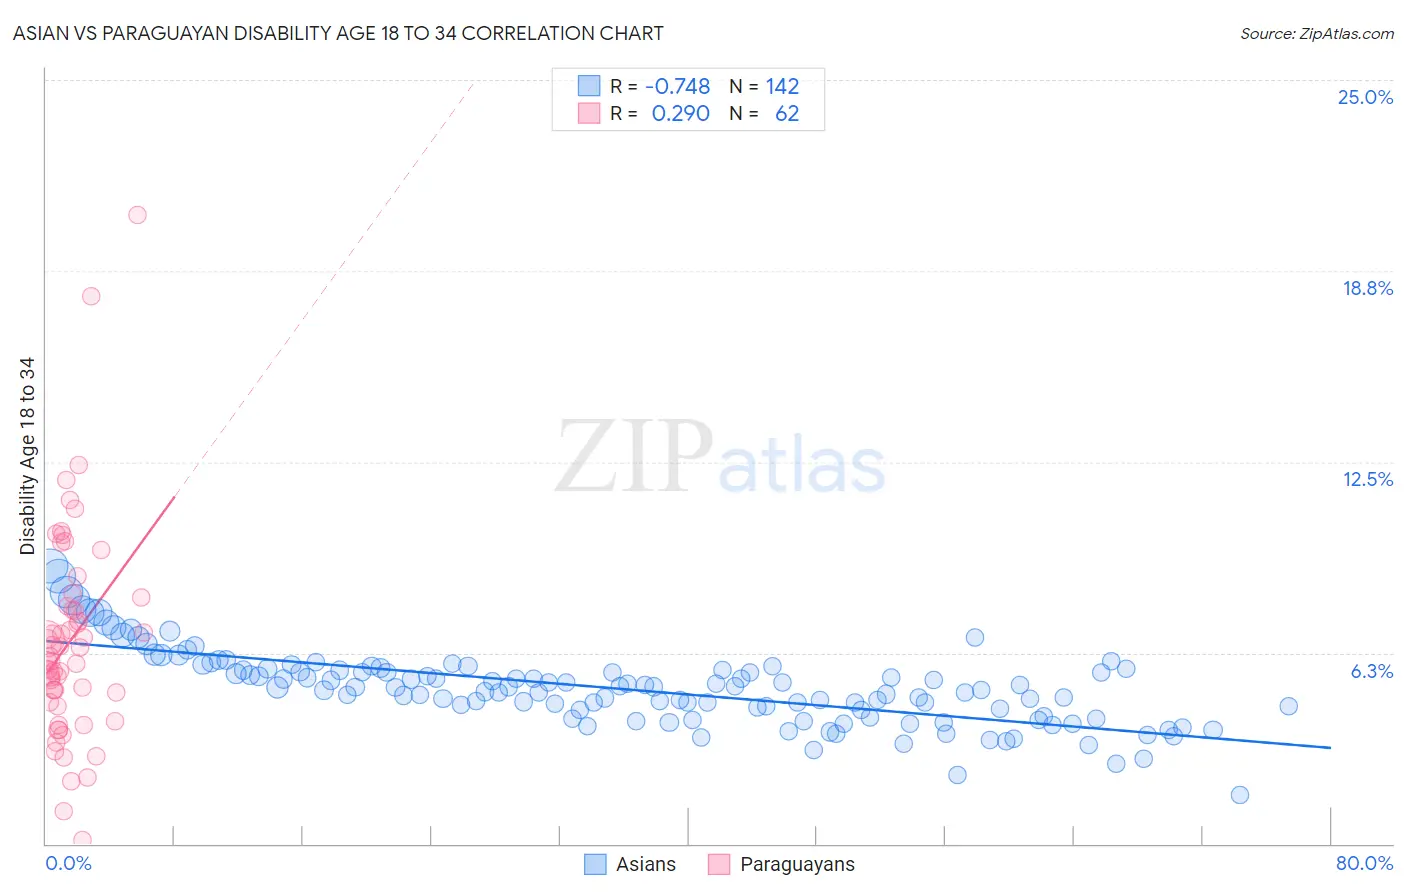
Asian vs Paraguayan Disability Age 18 to 34 Correlation Chart
The statistical analysis conducted on geographies consisting of 547,285,512 people shows a strong negative correlation between the proportion of Asians and percentage of population with a disability between the ages 18 and 35 in the United States with a correlation coefficient (R) of -0.748 and weighted average of 5.8%. Similarly, the statistical analysis conducted on geographies consisting of 95,068,899 people shows a weak positive correlation between the proportion of Paraguayans and percentage of population with a disability between the ages 18 and 35 in the United States with a correlation coefficient (R) of 0.290 and weighted average of 5.9%, a difference of 1.9%.
Disability Age 18 to 34 Correlation Summary
| Measurement | Asian | Paraguayan |
| Minimum | 1.6% | 0.13% |
| Maximum | 9.1% | 20.6% |
| Range | 7.5% | 20.5% |
| Mean | 5.1% | 6.6% |
| Median | 5.1% | 6.0% |
| Interquartile 25% (IQ1) | 4.4% | 4.6% |
| Interquartile 75% (IQ3) | 5.7% | 7.8% |
| Interquartile Range (IQR) | 1.3% | 3.1% |
| Standard Deviation (Sample) | 1.2% | 3.5% |
| Standard Deviation (Population) | 1.2% | 3.5% |
Demographics Similar to Asians and Paraguayans by Disability Age 18 to 34
In terms of disability age 18 to 34, the demographic groups most similar to Asians are Bolivian (5.8%, a difference of 0.080%), Nicaraguan (5.8%, a difference of 0.26%), Immigrants from South America (5.8%, a difference of 0.30%), Armenian (5.8%, a difference of 0.33%), and Colombian (5.9%, a difference of 0.47%). Similarly, the demographic groups most similar to Paraguayans are Immigrants from Haiti (5.9%, a difference of 0.11%), Immigrants from Spain (5.9%, a difference of 0.16%), Immigrants from Malaysia (5.9%, a difference of 0.17%), Immigrants from Indonesia (5.9%, a difference of 0.22%), and Okinawan (5.9%, a difference of 0.37%).
| Demographics | Rating | Rank | Disability Age 18 to 34 |
| Armenians | 99.9 /100 | #37 | Exceptional 5.8% |
| Immigrants | South America | 99.9 /100 | #38 | Exceptional 5.8% |
| Asians | 99.9 /100 | #39 | Exceptional 5.8% |
| Bolivians | 99.9 /100 | #40 | Exceptional 5.8% |
| Nicaraguans | 99.9 /100 | #41 | Exceptional 5.8% |
| Colombians | 99.8 /100 | #42 | Exceptional 5.9% |
| South Americans | 99.8 /100 | #43 | Exceptional 5.9% |
| Immigrants | Asia | 99.8 /100 | #44 | Exceptional 5.9% |
| Immigrants | Peru | 99.8 /100 | #45 | Exceptional 5.9% |
| Immigrants | Korea | 99.8 /100 | #46 | Exceptional 5.9% |
| Immigrants | Egypt | 99.8 /100 | #47 | Exceptional 5.9% |
| Immigrants | Trinidad and Tobago | 99.8 /100 | #48 | Exceptional 5.9% |
| Immigrants | Belarus | 99.8 /100 | #49 | Exceptional 5.9% |
| Immigrants | El Salvador | 99.8 /100 | #50 | Exceptional 5.9% |
| Egyptians | 99.8 /100 | #51 | Exceptional 5.9% |
| Okinawans | 99.7 /100 | #52 | Exceptional 5.9% |
| Immigrants | Indonesia | 99.7 /100 | #53 | Exceptional 5.9% |
| Immigrants | Malaysia | 99.7 /100 | #54 | Exceptional 5.9% |
| Immigrants | Spain | 99.7 /100 | #55 | Exceptional 5.9% |
| Paraguayans | 99.7 /100 | #56 | Exceptional 5.9% |
| Immigrants | Haiti | 99.7 /100 | #57 | Exceptional 5.9% |