Immigrants from Bulgaria vs Immigrants from Latin America Disability Age 5 to 17
COMPARE
Immigrants from Bulgaria
Immigrants from Latin America
Disability Age 5 to 17
Disability Age 5 to 17 Comparison
Immigrants from Bulgaria
Immigrants from Latin America
5.4%
DISABILITY AGE 5 TO 17
94.0/ 100
METRIC RATING
130th/ 347
METRIC RANK
5.6%
DISABILITY AGE 5 TO 17
34.3/ 100
METRIC RATING
183rd/ 347
METRIC RANK
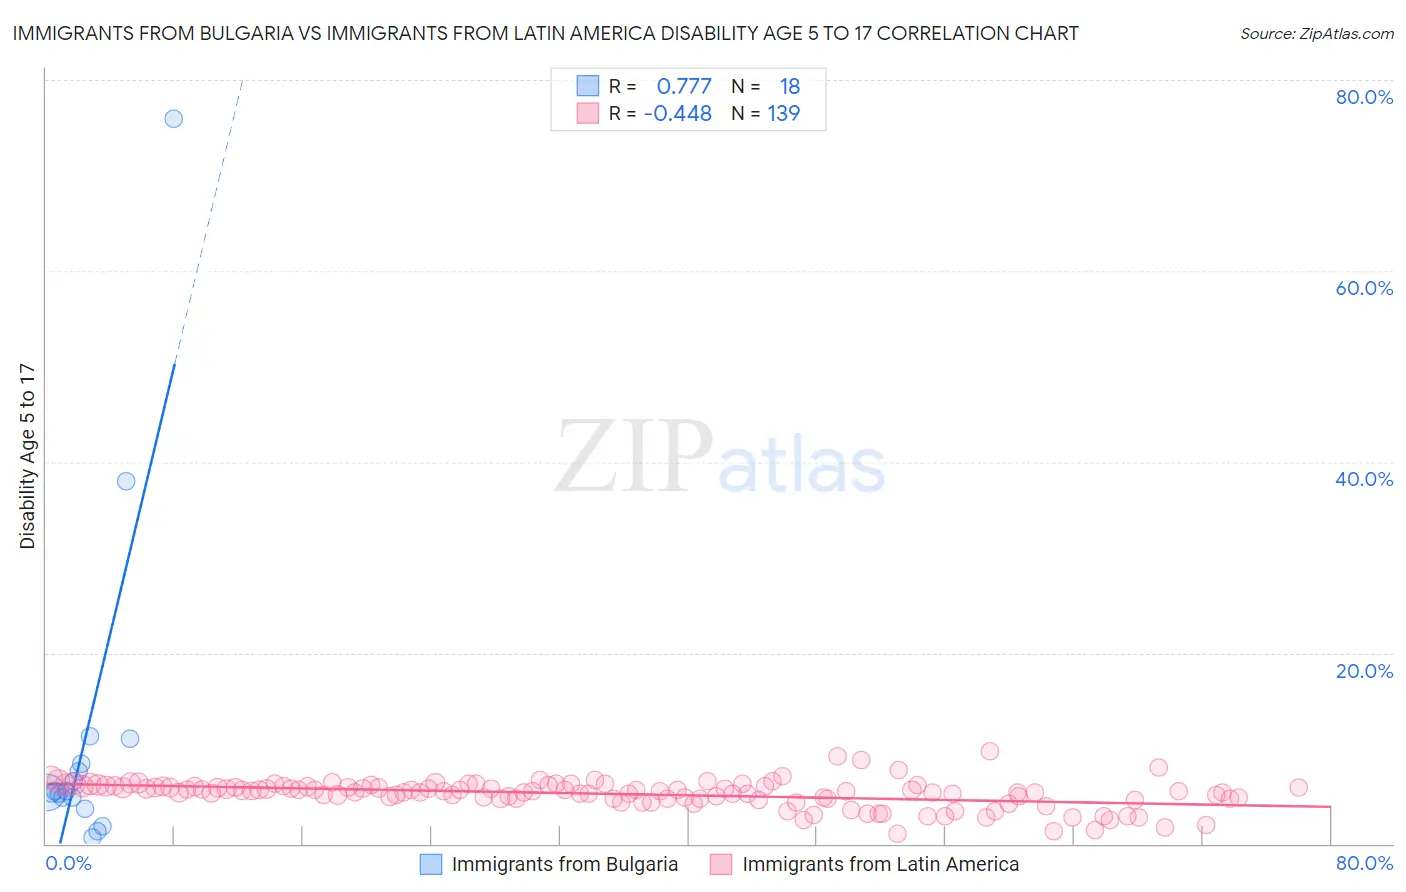
Immigrants from Bulgaria vs Immigrants from Latin America Disability Age 5 to 17 Correlation Chart
The statistical analysis conducted on geographies consisting of 171,828,354 people shows a strong positive correlation between the proportion of Immigrants from Bulgaria and percentage of population with a disability between the ages 5 and 17 in the United States with a correlation coefficient (R) of 0.777 and weighted average of 5.4%. Similarly, the statistical analysis conducted on geographies consisting of 547,403,428 people shows a moderate negative correlation between the proportion of Immigrants from Latin America and percentage of population with a disability between the ages 5 and 17 in the United States with a correlation coefficient (R) of -0.448 and weighted average of 5.6%, a difference of 4.4%.
Disability Age 5 to 17 Correlation Summary
| Measurement | Immigrants from Bulgaria | Immigrants from Latin America |
| Minimum | 0.67% | 1.0% |
| Maximum | 76.0% | 9.7% |
| Range | 75.3% | 8.7% |
| Mean | 11.3% | 5.2% |
| Median | 5.4% | 5.5% |
| Interquartile 25% (IQ1) | 4.8% | 4.7% |
| Interquartile 75% (IQ3) | 8.4% | 6.0% |
| Interquartile Range (IQR) | 3.6% | 1.3% |
| Standard Deviation (Sample) | 18.1% | 1.4% |
| Standard Deviation (Population) | 17.6% | 1.4% |
Similar Demographics by Disability Age 5 to 17
Demographics Similar to Immigrants from Bulgaria by Disability Age 5 to 17
In terms of disability age 5 to 17, the demographic groups most similar to Immigrants from Bulgaria are Romanian (5.4%, a difference of 0.020%), Immigrants from Venezuela (5.4%, a difference of 0.11%), New Zealander (5.4%, a difference of 0.23%), Latvian (5.4%, a difference of 0.23%), and Arab (5.4%, a difference of 0.23%).
| Demographics | Rating | Rank | Disability Age 5 to 17 |
| Immigrants | Ethiopia | 95.5 /100 | #123 | Exceptional 5.4% |
| Crow | 95.0 /100 | #124 | Exceptional 5.4% |
| Immigrants | Chile | 95.0 /100 | #125 | Exceptional 5.4% |
| New Zealanders | 95.0 /100 | #126 | Exceptional 5.4% |
| Latvians | 95.0 /100 | #127 | Exceptional 5.4% |
| Immigrants | Venezuela | 94.5 /100 | #128 | Exceptional 5.4% |
| Romanians | 94.1 /100 | #129 | Exceptional 5.4% |
| Immigrants | Bulgaria | 94.0 /100 | #130 | Exceptional 5.4% |
| Arabs | 92.9 /100 | #131 | Exceptional 5.4% |
| Immigrants | Colombia | 92.9 /100 | #132 | Exceptional 5.4% |
| Venezuelans | 92.7 /100 | #133 | Exceptional 5.4% |
| Yuman | 92.3 /100 | #134 | Exceptional 5.4% |
| Immigrants | Belize | 91.7 /100 | #135 | Exceptional 5.4% |
| Immigrants | Denmark | 91.4 /100 | #136 | Exceptional 5.4% |
| Navajo | 90.9 /100 | #137 | Exceptional 5.4% |
Demographics Similar to Immigrants from Latin America by Disability Age 5 to 17
In terms of disability age 5 to 17, the demographic groups most similar to Immigrants from Latin America are Syrian (5.6%, a difference of 0.020%), Immigrants from Mexico (5.6%, a difference of 0.030%), Mexican American Indian (5.6%, a difference of 0.050%), Immigrants from England (5.6%, a difference of 0.11%), and Fijian (5.7%, a difference of 0.14%).
| Demographics | Rating | Rank | Disability Age 5 to 17 |
| Immigrants | Central America | 49.4 /100 | #176 | Average 5.6% |
| Immigrants | Western Europe | 47.8 /100 | #177 | Average 5.6% |
| Immigrants | Trinidad and Tobago | 47.6 /100 | #178 | Average 5.6% |
| Immigrants | Barbados | 40.5 /100 | #179 | Average 5.6% |
| Immigrants | Uruguay | 37.7 /100 | #180 | Fair 5.6% |
| Immigrants | England | 36.4 /100 | #181 | Fair 5.6% |
| Mexican American Indians | 35.2 /100 | #182 | Fair 5.6% |
| Immigrants | Latin America | 34.3 /100 | #183 | Fair 5.6% |
| Syrians | 33.8 /100 | #184 | Fair 5.6% |
| Immigrants | Mexico | 33.7 /100 | #185 | Fair 5.6% |
| Fijians | 31.7 /100 | #186 | Fair 5.7% |
| Immigrants | Thailand | 30.2 /100 | #187 | Fair 5.7% |
| Marshallese | 28.1 /100 | #188 | Fair 5.7% |
| Pueblo | 27.5 /100 | #189 | Fair 5.7% |
| Immigrants | Eastern Africa | 27.3 /100 | #190 | Fair 5.7% |