Puget Sound Salish vs Immigrants from Latin America Disability Age 5 to 17
COMPARE
Puget Sound Salish
Immigrants from Latin America
Disability Age 5 to 17
Disability Age 5 to 17 Comparison
Puget Sound Salish
Immigrants from Latin America
6.1%
DISABILITY AGE 5 TO 17
0.1/ 100
METRIC RATING
277th/ 347
METRIC RANK
5.6%
DISABILITY AGE 5 TO 17
34.3/ 100
METRIC RATING
183rd/ 347
METRIC RANK
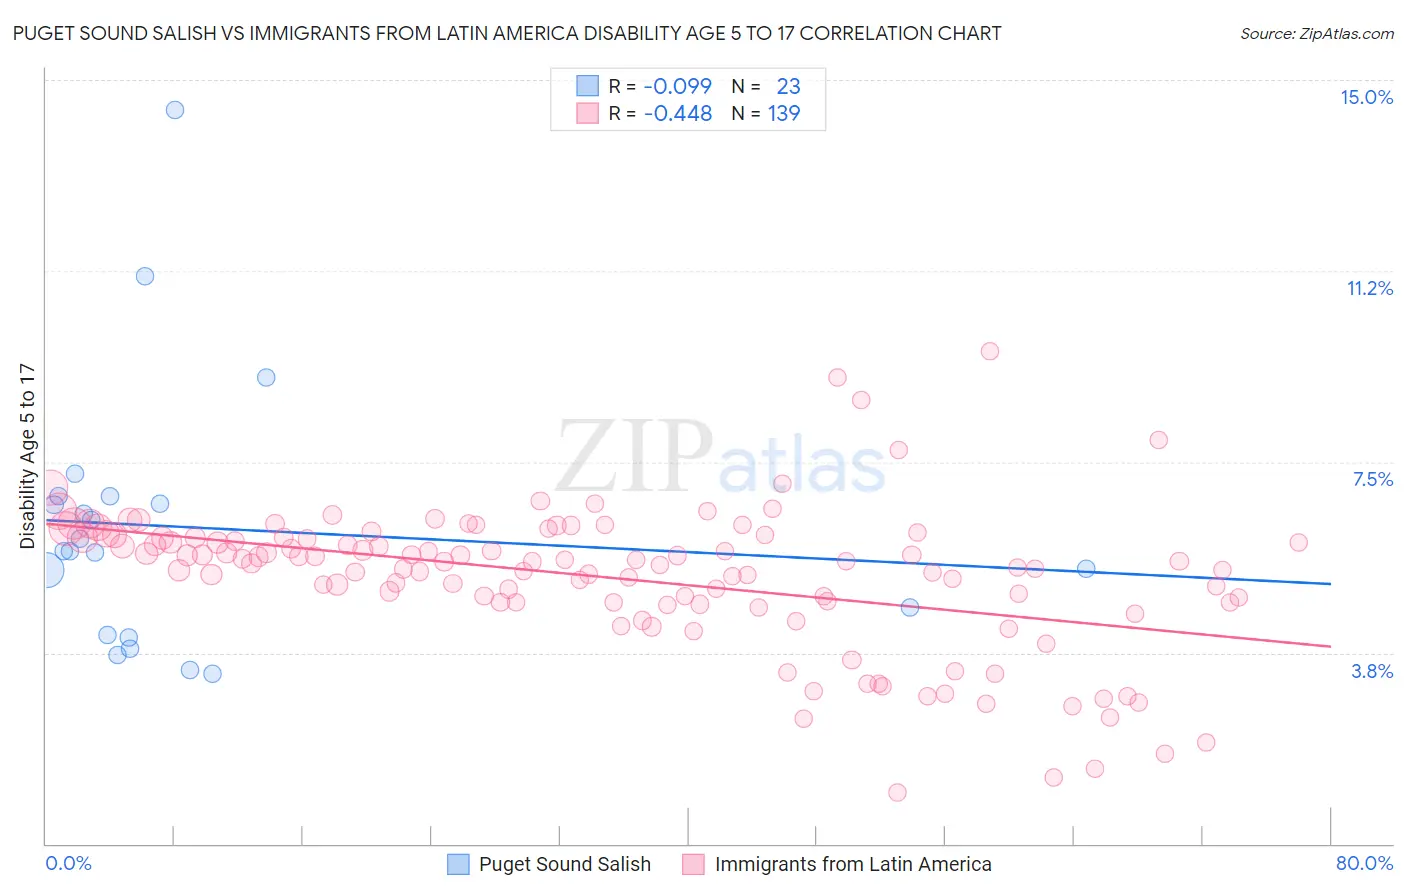
Puget Sound Salish vs Immigrants from Latin America Disability Age 5 to 17 Correlation Chart
The statistical analysis conducted on geographies consisting of 46,037,254 people shows a slight negative correlation between the proportion of Puget Sound Salish and percentage of population with a disability between the ages 5 and 17 in the United States with a correlation coefficient (R) of -0.099 and weighted average of 6.1%. Similarly, the statistical analysis conducted on geographies consisting of 547,403,428 people shows a moderate negative correlation between the proportion of Immigrants from Latin America and percentage of population with a disability between the ages 5 and 17 in the United States with a correlation coefficient (R) of -0.448 and weighted average of 5.6%, a difference of 8.0%.
Disability Age 5 to 17 Correlation Summary
| Measurement | Puget Sound Salish | Immigrants from Latin America |
| Minimum | 3.3% | 1.0% |
| Maximum | 14.4% | 9.7% |
| Range | 11.1% | 8.7% |
| Mean | 6.2% | 5.2% |
| Median | 5.8% | 5.5% |
| Interquartile 25% (IQ1) | 4.1% | 4.7% |
| Interquartile 75% (IQ3) | 6.8% | 6.0% |
| Interquartile Range (IQR) | 2.7% | 1.3% |
| Standard Deviation (Sample) | 2.6% | 1.4% |
| Standard Deviation (Population) | 2.5% | 1.4% |
Similar Demographics by Disability Age 5 to 17
Demographics Similar to Puget Sound Salish by Disability Age 5 to 17
In terms of disability age 5 to 17, the demographic groups most similar to Puget Sound Salish are Immigrants from Liberia (6.1%, a difference of 0.080%), Immigrants from Jamaica (6.1%, a difference of 0.22%), Portuguese (6.1%, a difference of 0.36%), Scottish (6.1%, a difference of 0.61%), and Japanese (6.1%, a difference of 0.72%).
| Demographics | Rating | Rank | Disability Age 5 to 17 |
| Immigrants | Somalia | 0.4 /100 | #270 | Tragic 6.0% |
| Immigrants | Zaire | 0.2 /100 | #271 | Tragic 6.0% |
| Finns | 0.2 /100 | #272 | Tragic 6.0% |
| Alaska Natives | 0.2 /100 | #273 | Tragic 6.0% |
| Cheyenne | 0.2 /100 | #274 | Tragic 6.0% |
| Dutch | 0.2 /100 | #275 | Tragic 6.0% |
| Japanese | 0.1 /100 | #276 | Tragic 6.1% |
| Puget Sound Salish | 0.1 /100 | #277 | Tragic 6.1% |
| Immigrants | Liberia | 0.1 /100 | #278 | Tragic 6.1% |
| Immigrants | Jamaica | 0.1 /100 | #279 | Tragic 6.1% |
| Portuguese | 0.1 /100 | #280 | Tragic 6.1% |
| Scottish | 0.0 /100 | #281 | Tragic 6.1% |
| Germans | 0.0 /100 | #282 | Tragic 6.1% |
| Ugandans | 0.0 /100 | #283 | Tragic 6.2% |
| Sub-Saharan Africans | 0.0 /100 | #284 | Tragic 6.2% |
Demographics Similar to Immigrants from Latin America by Disability Age 5 to 17
In terms of disability age 5 to 17, the demographic groups most similar to Immigrants from Latin America are Syrian (5.6%, a difference of 0.020%), Immigrants from Mexico (5.6%, a difference of 0.030%), Mexican American Indian (5.6%, a difference of 0.050%), Immigrants from England (5.6%, a difference of 0.11%), and Fijian (5.7%, a difference of 0.14%).
| Demographics | Rating | Rank | Disability Age 5 to 17 |
| Immigrants | Central America | 49.4 /100 | #176 | Average 5.6% |
| Immigrants | Western Europe | 47.8 /100 | #177 | Average 5.6% |
| Immigrants | Trinidad and Tobago | 47.6 /100 | #178 | Average 5.6% |
| Immigrants | Barbados | 40.5 /100 | #179 | Average 5.6% |
| Immigrants | Uruguay | 37.7 /100 | #180 | Fair 5.6% |
| Immigrants | England | 36.4 /100 | #181 | Fair 5.6% |
| Mexican American Indians | 35.2 /100 | #182 | Fair 5.6% |
| Immigrants | Latin America | 34.3 /100 | #183 | Fair 5.6% |
| Syrians | 33.8 /100 | #184 | Fair 5.6% |
| Immigrants | Mexico | 33.7 /100 | #185 | Fair 5.6% |
| Fijians | 31.7 /100 | #186 | Fair 5.7% |
| Immigrants | Thailand | 30.2 /100 | #187 | Fair 5.7% |
| Marshallese | 28.1 /100 | #188 | Fair 5.7% |
| Pueblo | 27.5 /100 | #189 | Fair 5.7% |
| Immigrants | Eastern Africa | 27.3 /100 | #190 | Fair 5.7% |