Immigrants from Hungary vs Filipino Disability Age 65 to 74
COMPARE
Immigrants from Hungary
Filipino
Disability Age 65 to 74
Disability Age 65 to 74 Comparison
Immigrants from Hungary
Filipinos
21.7%
DISABILITY AGE 65 TO 74
99.2/ 100
METRIC RATING
72nd/ 347
METRIC RANK
19.0%
DISABILITY AGE 65 TO 74
100.0/ 100
METRIC RATING
2nd/ 347
METRIC RANK
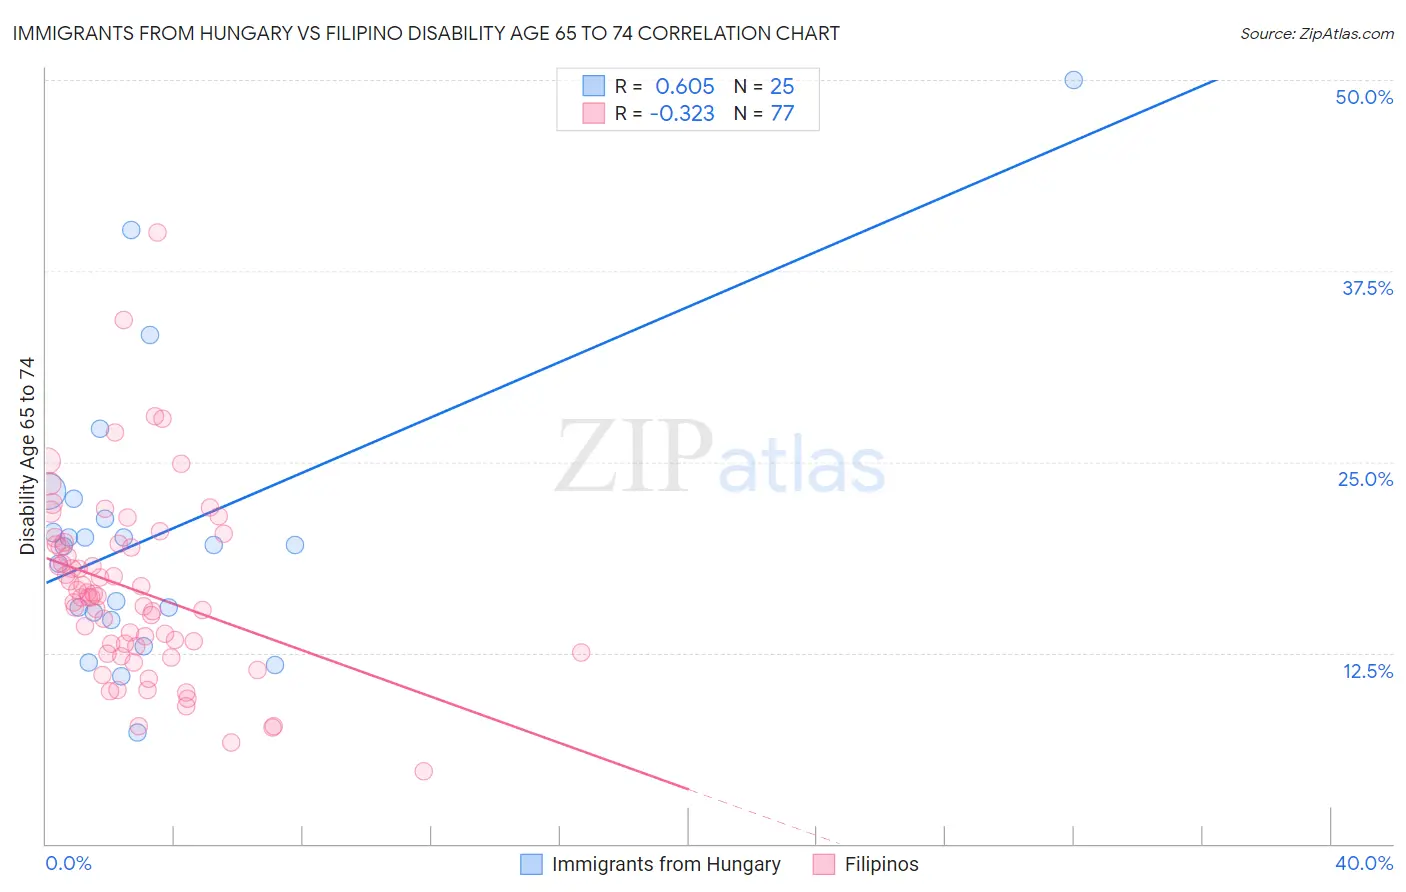
Immigrants from Hungary vs Filipino Disability Age 65 to 74 Correlation Chart
The statistical analysis conducted on geographies consisting of 195,586,692 people shows a significant positive correlation between the proportion of Immigrants from Hungary and percentage of population with a disability between the ages 65 and 75 in the United States with a correlation coefficient (R) of 0.605 and weighted average of 21.7%. Similarly, the statistical analysis conducted on geographies consisting of 253,881,065 people shows a mild negative correlation between the proportion of Filipinos and percentage of population with a disability between the ages 65 and 75 in the United States with a correlation coefficient (R) of -0.323 and weighted average of 19.0%, a difference of 14.3%.
Disability Age 65 to 74 Correlation Summary
| Measurement | Immigrants from Hungary | Filipino |
| Minimum | 7.3% | 4.7% |
| Maximum | 50.0% | 40.0% |
| Range | 42.7% | 35.3% |
| Mean | 20.3% | 16.6% |
| Median | 19.6% | 16.1% |
| Interquartile 25% (IQ1) | 14.9% | 12.7% |
| Interquartile 75% (IQ3) | 21.9% | 19.6% |
| Interquartile Range (IQR) | 7.0% | 6.9% |
| Standard Deviation (Sample) | 9.3% | 6.0% |
| Standard Deviation (Population) | 9.2% | 6.0% |
Similar Demographics by Disability Age 65 to 74
Demographics Similar to Immigrants from Hungary by Disability Age 65 to 74
In terms of disability age 65 to 74, the demographic groups most similar to Immigrants from Hungary are Immigrants from Belarus (21.7%, a difference of 0.010%), Immigrants from Egypt (21.7%, a difference of 0.070%), Chinese (21.7%, a difference of 0.070%), Immigrants from Venezuela (21.8%, a difference of 0.19%), and Immigrants from Scotland (21.7%, a difference of 0.20%).
| Demographics | Rating | Rank | Disability Age 65 to 74 |
| Immigrants | Russia | 99.4 /100 | #65 | Exceptional 21.6% |
| Maltese | 99.4 /100 | #66 | Exceptional 21.6% |
| Immigrants | South Africa | 99.3 /100 | #67 | Exceptional 21.7% |
| Immigrants | Scotland | 99.3 /100 | #68 | Exceptional 21.7% |
| Immigrants | Egypt | 99.2 /100 | #69 | Exceptional 21.7% |
| Chinese | 99.2 /100 | #70 | Exceptional 21.7% |
| Immigrants | Belarus | 99.2 /100 | #71 | Exceptional 21.7% |
| Immigrants | Hungary | 99.2 /100 | #72 | Exceptional 21.7% |
| Immigrants | Venezuela | 99.0 /100 | #73 | Exceptional 21.8% |
| Cambodians | 99.0 /100 | #74 | Exceptional 21.8% |
| Mongolians | 99.0 /100 | #75 | Exceptional 21.8% |
| Greeks | 99.0 /100 | #76 | Exceptional 21.8% |
| Immigrants | Poland | 99.0 /100 | #77 | Exceptional 21.8% |
| Immigrants | Eastern Europe | 99.0 /100 | #78 | Exceptional 21.8% |
| Venezuelans | 99.0 /100 | #79 | Exceptional 21.8% |
Demographics Similar to Filipinos by Disability Age 65 to 74
In terms of disability age 65 to 74, the demographic groups most similar to Filipinos are Immigrants from Taiwan (18.8%, a difference of 1.2%), Immigrants from India (19.7%, a difference of 3.6%), Immigrants from Hong Kong (19.9%, a difference of 4.5%), Immigrants from Israel (19.9%, a difference of 4.8%), and Iranian (19.9%, a difference of 4.9%).
| Demographics | Rating | Rank | Disability Age 65 to 74 |
| Immigrants | Taiwan | 100.0 /100 | #1 | Exceptional 18.8% |
| Filipinos | 100.0 /100 | #2 | Exceptional 19.0% |
| Immigrants | India | 100.0 /100 | #3 | Exceptional 19.7% |
| Immigrants | Hong Kong | 100.0 /100 | #4 | Exceptional 19.9% |
| Immigrants | Israel | 100.0 /100 | #5 | Exceptional 19.9% |
| Iranians | 100.0 /100 | #6 | Exceptional 19.9% |
| Cypriots | 100.0 /100 | #7 | Exceptional 20.1% |
| Thais | 100.0 /100 | #8 | Exceptional 20.1% |
| Immigrants | China | 100.0 /100 | #9 | Exceptional 20.3% |
| Immigrants | Eastern Asia | 100.0 /100 | #10 | Exceptional 20.3% |
| Immigrants | Ireland | 100.0 /100 | #11 | Exceptional 20.3% |
| Immigrants | Korea | 100.0 /100 | #12 | Exceptional 20.4% |
| Immigrants | Singapore | 100.0 /100 | #13 | Exceptional 20.4% |
| Indians (Asian) | 100.0 /100 | #14 | Exceptional 20.5% |
| Paraguayans | 100.0 /100 | #15 | Exceptional 20.5% |