Yakama vs Filipino Disability Age 65 to 74
COMPARE
Yakama
Filipino
Disability Age 65 to 74
Disability Age 65 to 74 Comparison
Yakama
Filipinos
29.6%
DISABILITY AGE 65 TO 74
0.0/ 100
METRIC RATING
326th/ 347
METRIC RANK
19.0%
DISABILITY AGE 65 TO 74
100.0/ 100
METRIC RATING
2nd/ 347
METRIC RANK
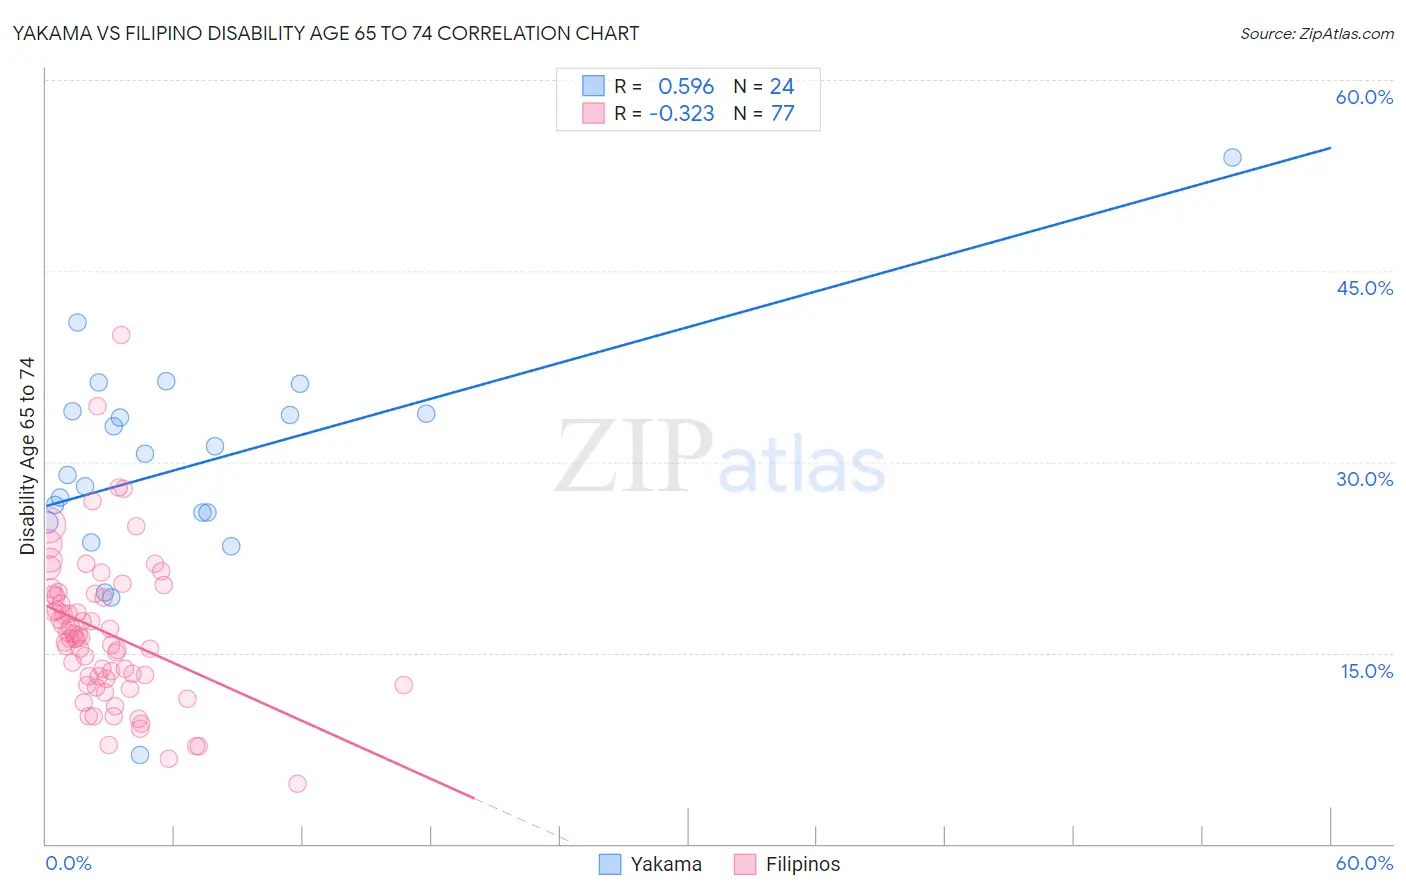
Yakama vs Filipino Disability Age 65 to 74 Correlation Chart
The statistical analysis conducted on geographies consisting of 19,894,634 people shows a substantial positive correlation between the proportion of Yakama and percentage of population with a disability between the ages 65 and 75 in the United States with a correlation coefficient (R) of 0.596 and weighted average of 29.6%. Similarly, the statistical analysis conducted on geographies consisting of 253,881,065 people shows a mild negative correlation between the proportion of Filipinos and percentage of population with a disability between the ages 65 and 75 in the United States with a correlation coefficient (R) of -0.323 and weighted average of 19.0%, a difference of 55.9%.
Disability Age 65 to 74 Correlation Summary
| Measurement | Yakama | Filipino |
| Minimum | 7.0% | 4.7% |
| Maximum | 54.0% | 40.0% |
| Range | 47.0% | 35.3% |
| Mean | 29.8% | 16.6% |
| Median | 29.8% | 16.1% |
| Interquartile 25% (IQ1) | 25.6% | 12.7% |
| Interquartile 75% (IQ3) | 33.9% | 19.6% |
| Interquartile Range (IQR) | 8.3% | 6.9% |
| Standard Deviation (Sample) | 8.8% | 6.0% |
| Standard Deviation (Population) | 8.6% | 6.0% |
Similar Demographics by Disability Age 65 to 74
Demographics Similar to Yakama by Disability Age 65 to 74
In terms of disability age 65 to 74, the demographic groups most similar to Yakama are Apache (29.7%, a difference of 0.16%), Dutch West Indian (29.6%, a difference of 0.23%), Seminole (29.4%, a difference of 0.68%), Hopi (30.0%, a difference of 1.1%), and Puerto Rican (29.1%, a difference of 1.7%).
| Demographics | Rating | Rank | Disability Age 65 to 74 |
| Arapaho | 0.0 /100 | #319 | Tragic 28.1% |
| Cherokee | 0.0 /100 | #320 | Tragic 28.2% |
| Comanche | 0.0 /100 | #321 | Tragic 28.3% |
| Aleuts | 0.0 /100 | #322 | Tragic 28.4% |
| Puerto Ricans | 0.0 /100 | #323 | Tragic 29.1% |
| Seminole | 0.0 /100 | #324 | Tragic 29.4% |
| Dutch West Indians | 0.0 /100 | #325 | Tragic 29.6% |
| Yakama | 0.0 /100 | #326 | Tragic 29.6% |
| Apache | 0.0 /100 | #327 | Tragic 29.7% |
| Hopi | 0.0 /100 | #328 | Tragic 30.0% |
| Choctaw | 0.0 /100 | #329 | Tragic 30.2% |
| Creek | 0.0 /100 | #330 | Tragic 30.2% |
| Chickasaw | 0.0 /100 | #331 | Tragic 30.2% |
| Natives/Alaskans | 0.0 /100 | #332 | Tragic 30.4% |
| Colville | 0.0 /100 | #333 | Tragic 30.5% |
Demographics Similar to Filipinos by Disability Age 65 to 74
In terms of disability age 65 to 74, the demographic groups most similar to Filipinos are Immigrants from Taiwan (18.8%, a difference of 1.2%), Immigrants from India (19.7%, a difference of 3.6%), Immigrants from Hong Kong (19.9%, a difference of 4.5%), Immigrants from Israel (19.9%, a difference of 4.8%), and Iranian (19.9%, a difference of 4.9%).
| Demographics | Rating | Rank | Disability Age 65 to 74 |
| Immigrants | Taiwan | 100.0 /100 | #1 | Exceptional 18.8% |
| Filipinos | 100.0 /100 | #2 | Exceptional 19.0% |
| Immigrants | India | 100.0 /100 | #3 | Exceptional 19.7% |
| Immigrants | Hong Kong | 100.0 /100 | #4 | Exceptional 19.9% |
| Immigrants | Israel | 100.0 /100 | #5 | Exceptional 19.9% |
| Iranians | 100.0 /100 | #6 | Exceptional 19.9% |
| Cypriots | 100.0 /100 | #7 | Exceptional 20.1% |
| Thais | 100.0 /100 | #8 | Exceptional 20.1% |
| Immigrants | China | 100.0 /100 | #9 | Exceptional 20.3% |
| Immigrants | Eastern Asia | 100.0 /100 | #10 | Exceptional 20.3% |
| Immigrants | Ireland | 100.0 /100 | #11 | Exceptional 20.3% |
| Immigrants | Korea | 100.0 /100 | #12 | Exceptional 20.4% |
| Immigrants | Singapore | 100.0 /100 | #13 | Exceptional 20.4% |
| Indians (Asian) | 100.0 /100 | #14 | Exceptional 20.5% |
| Paraguayans | 100.0 /100 | #15 | Exceptional 20.5% |