Immigrants from Burma/Myanmar vs Filipino Disability Age 65 to 74
COMPARE
Immigrants from Burma/Myanmar
Filipino
Disability Age 65 to 74
Disability Age 65 to 74 Comparison
Immigrants from Burma/Myanmar
Filipinos
24.0%
DISABILITY AGE 65 TO 74
11.6/ 100
METRIC RATING
219th/ 347
METRIC RANK
19.0%
DISABILITY AGE 65 TO 74
100.0/ 100
METRIC RATING
2nd/ 347
METRIC RANK
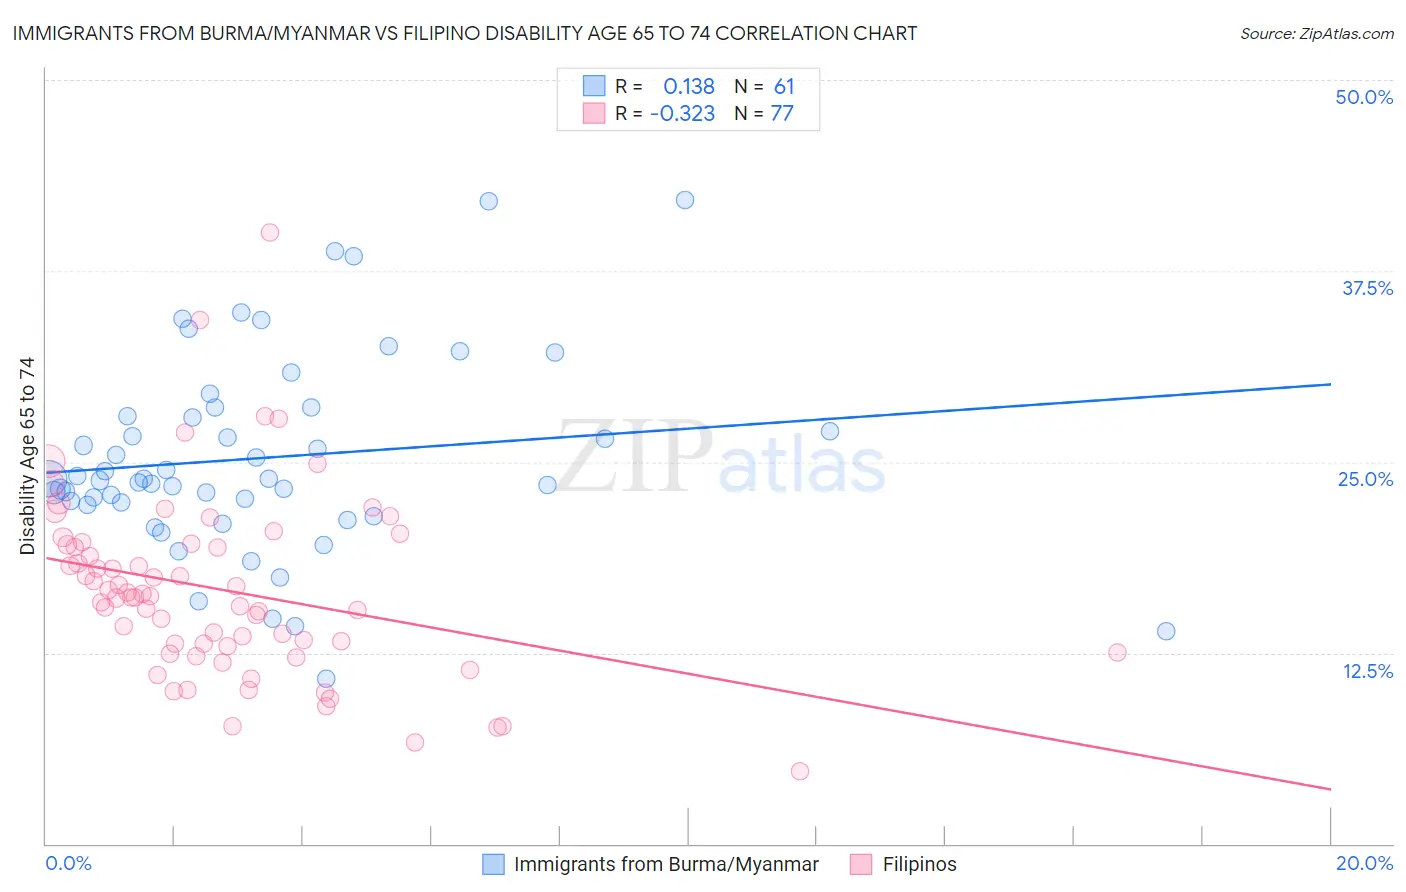
Immigrants from Burma/Myanmar vs Filipino Disability Age 65 to 74 Correlation Chart
The statistical analysis conducted on geographies consisting of 172,172,101 people shows a poor positive correlation between the proportion of Immigrants from Burma/Myanmar and percentage of population with a disability between the ages 65 and 75 in the United States with a correlation coefficient (R) of 0.138 and weighted average of 24.0%. Similarly, the statistical analysis conducted on geographies consisting of 253,881,065 people shows a mild negative correlation between the proportion of Filipinos and percentage of population with a disability between the ages 65 and 75 in the United States with a correlation coefficient (R) of -0.323 and weighted average of 19.0%, a difference of 26.5%.
Disability Age 65 to 74 Correlation Summary
| Measurement | Immigrants from Burma/Myanmar | Filipino |
| Minimum | 10.8% | 4.7% |
| Maximum | 42.1% | 40.0% |
| Range | 31.3% | 35.3% |
| Mean | 25.3% | 16.6% |
| Median | 23.9% | 16.1% |
| Interquartile 25% (IQ1) | 22.3% | 12.7% |
| Interquartile 75% (IQ3) | 28.3% | 19.6% |
| Interquartile Range (IQR) | 6.0% | 6.9% |
| Standard Deviation (Sample) | 6.5% | 6.0% |
| Standard Deviation (Population) | 6.4% | 6.0% |
Similar Demographics by Disability Age 65 to 74
Demographics Similar to Immigrants from Burma/Myanmar by Disability Age 65 to 74
In terms of disability age 65 to 74, the demographic groups most similar to Immigrants from Burma/Myanmar are Immigrants from Portugal (24.0%, a difference of 0.020%), Immigrants from Nigeria (24.0%, a difference of 0.020%), Jamaican (24.0%, a difference of 0.090%), Ghanaian (24.1%, a difference of 0.18%), and Pennsylvania German (24.0%, a difference of 0.22%).
| Demographics | Rating | Rank | Disability Age 65 to 74 |
| French | 15.7 /100 | #212 | Poor 23.9% |
| Nicaraguans | 14.3 /100 | #213 | Poor 23.9% |
| Immigrants | Oceania | 13.6 /100 | #214 | Poor 24.0% |
| Pennsylvania Germans | 13.3 /100 | #215 | Poor 24.0% |
| Jamaicans | 12.2 /100 | #216 | Poor 24.0% |
| Immigrants | Portugal | 11.7 /100 | #217 | Poor 24.0% |
| Immigrants | Nigeria | 11.7 /100 | #218 | Poor 24.0% |
| Immigrants | Burma/Myanmar | 11.6 /100 | #219 | Poor 24.0% |
| Ghanaians | 10.4 /100 | #220 | Poor 24.1% |
| Immigrants | Nicaragua | 9.8 /100 | #221 | Tragic 24.1% |
| Native Hawaiians | 9.3 /100 | #222 | Tragic 24.1% |
| Immigrants | Middle Africa | 8.9 /100 | #223 | Tragic 24.1% |
| Immigrants | Panama | 8.6 /100 | #224 | Tragic 24.1% |
| Bermudans | 8.2 /100 | #225 | Tragic 24.2% |
| Iraqis | 8.1 /100 | #226 | Tragic 24.2% |
Demographics Similar to Filipinos by Disability Age 65 to 74
In terms of disability age 65 to 74, the demographic groups most similar to Filipinos are Immigrants from Taiwan (18.8%, a difference of 1.2%), Immigrants from India (19.7%, a difference of 3.6%), Immigrants from Hong Kong (19.9%, a difference of 4.5%), Immigrants from Israel (19.9%, a difference of 4.8%), and Iranian (19.9%, a difference of 4.9%).
| Demographics | Rating | Rank | Disability Age 65 to 74 |
| Immigrants | Taiwan | 100.0 /100 | #1 | Exceptional 18.8% |
| Filipinos | 100.0 /100 | #2 | Exceptional 19.0% |
| Immigrants | India | 100.0 /100 | #3 | Exceptional 19.7% |
| Immigrants | Hong Kong | 100.0 /100 | #4 | Exceptional 19.9% |
| Immigrants | Israel | 100.0 /100 | #5 | Exceptional 19.9% |
| Iranians | 100.0 /100 | #6 | Exceptional 19.9% |
| Cypriots | 100.0 /100 | #7 | Exceptional 20.1% |
| Thais | 100.0 /100 | #8 | Exceptional 20.1% |
| Immigrants | China | 100.0 /100 | #9 | Exceptional 20.3% |
| Immigrants | Eastern Asia | 100.0 /100 | #10 | Exceptional 20.3% |
| Immigrants | Ireland | 100.0 /100 | #11 | Exceptional 20.3% |
| Immigrants | Korea | 100.0 /100 | #12 | Exceptional 20.4% |
| Immigrants | Singapore | 100.0 /100 | #13 | Exceptional 20.4% |
| Indians (Asian) | 100.0 /100 | #14 | Exceptional 20.5% |
| Paraguayans | 100.0 /100 | #15 | Exceptional 20.5% |