Scotch-Irish vs Bulgarian 2 or more Vehicles in Household
COMPARE
Scotch-Irish
Bulgarian
2 or more Vehicles in Household
2 or more Vehicles in Household Comparison
Scotch-Irish
Bulgarians
60.9%
2 OR MORE VEHICLES IN HOUSEHOLD
100.0/ 100
METRIC RATING
23rd/ 347
METRIC RANK
56.5%
2 OR MORE VEHICLES IN HOUSEHOLD
89.7/ 100
METRIC RATING
131st/ 347
METRIC RANK
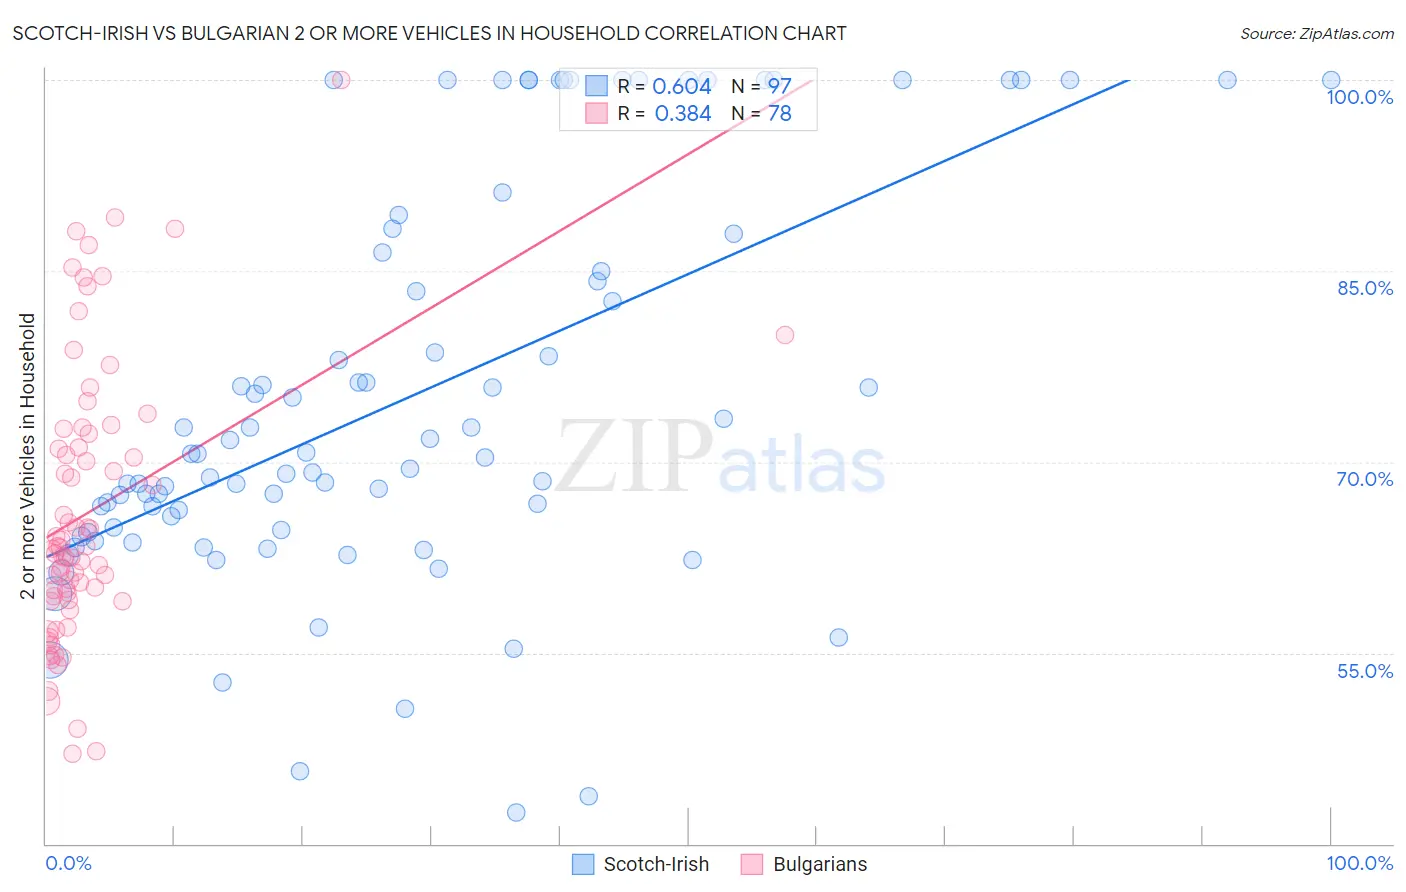
Scotch-Irish vs Bulgarian 2 or more Vehicles in Household Correlation Chart
The statistical analysis conducted on geographies consisting of 548,429,166 people shows a significant positive correlation between the proportion of Scotch-Irish and percentage of households with 2 or more vehicles available in the United States with a correlation coefficient (R) of 0.604 and weighted average of 60.9%. Similarly, the statistical analysis conducted on geographies consisting of 205,573,622 people shows a mild positive correlation between the proportion of Bulgarians and percentage of households with 2 or more vehicles available in the United States with a correlation coefficient (R) of 0.384 and weighted average of 56.5%, a difference of 7.8%.
2 or more Vehicles in Household Correlation Summary
| Measurement | Scotch-Irish | Bulgarian |
| Minimum | 42.5% | 47.1% |
| Maximum | 100.0% | 100.0% |
| Range | 57.5% | 52.9% |
| Mean | 75.1% | 66.1% |
| Median | 70.6% | 63.2% |
| Interquartile 25% (IQ1) | 64.5% | 59.1% |
| Interquartile 75% (IQ3) | 87.2% | 72.2% |
| Interquartile Range (IQR) | 22.6% | 13.1% |
| Standard Deviation (Sample) | 15.5% | 10.9% |
| Standard Deviation (Population) | 15.4% | 10.8% |
Similar Demographics by 2 or more Vehicles in Household
Demographics Similar to Scotch-Irish by 2 or more Vehicles in Household
In terms of 2 or more vehicles in household, the demographic groups most similar to Scotch-Irish are Swiss (61.0%, a difference of 0.040%), Immigrants from Vietnam (60.9%, a difference of 0.040%), Korean (61.0%, a difference of 0.070%), Sri Lankan (61.0%, a difference of 0.12%), and White/Caucasian (60.8%, a difference of 0.19%).
| Demographics | Rating | Rank | 2 or more Vehicles in Household |
| Native Hawaiians | 100.0 /100 | #16 | Exceptional 61.4% |
| Basques | 100.0 /100 | #17 | Exceptional 61.4% |
| Europeans | 100.0 /100 | #18 | Exceptional 61.4% |
| Scottish | 100.0 /100 | #19 | Exceptional 61.2% |
| Sri Lankans | 100.0 /100 | #20 | Exceptional 61.0% |
| Koreans | 100.0 /100 | #21 | Exceptional 61.0% |
| Swiss | 100.0 /100 | #22 | Exceptional 61.0% |
| Scotch-Irish | 100.0 /100 | #23 | Exceptional 60.9% |
| Immigrants | Vietnam | 100.0 /100 | #24 | Exceptional 60.9% |
| Whites/Caucasians | 100.0 /100 | #25 | Exceptional 60.8% |
| Welsh | 100.0 /100 | #26 | Exceptional 60.8% |
| Assyrians/Chaldeans/Syriacs | 100.0 /100 | #27 | Exceptional 60.5% |
| Guamanians/Chamorros | 100.0 /100 | #28 | Exceptional 60.5% |
| Hawaiians | 100.0 /100 | #29 | Exceptional 60.4% |
| Finns | 100.0 /100 | #30 | Exceptional 60.3% |
Demographics Similar to Bulgarians by 2 or more Vehicles in Household
In terms of 2 or more vehicles in household, the demographic groups most similar to Bulgarians are Yugoslavian (56.6%, a difference of 0.030%), Hungarian (56.5%, a difference of 0.060%), Ute (56.6%, a difference of 0.070%), Immigrants from South Central Asia (56.6%, a difference of 0.080%), and Immigrants from Thailand (56.6%, a difference of 0.10%).
| Demographics | Rating | Rank | 2 or more Vehicles in Household |
| New Zealanders | 91.8 /100 | #124 | Exceptional 56.7% |
| Tsimshian | 91.6 /100 | #125 | Exceptional 56.7% |
| Estonians | 90.9 /100 | #126 | Exceptional 56.6% |
| Immigrants | Thailand | 90.7 /100 | #127 | Exceptional 56.6% |
| Immigrants | South Central Asia | 90.5 /100 | #128 | Exceptional 56.6% |
| Ute | 90.4 /100 | #129 | Exceptional 56.6% |
| Yugoslavians | 90.0 /100 | #130 | Exceptional 56.6% |
| Bulgarians | 89.7 /100 | #131 | Excellent 56.5% |
| Hungarians | 89.1 /100 | #132 | Excellent 56.5% |
| Comanche | 88.4 /100 | #133 | Excellent 56.5% |
| Immigrants | Azores | 86.6 /100 | #134 | Excellent 56.4% |
| Blackfeet | 86.5 /100 | #135 | Excellent 56.4% |
| Immigrants | Asia | 86.0 /100 | #136 | Excellent 56.3% |
| Cubans | 84.8 /100 | #137 | Excellent 56.3% |
| Salvadorans | 84.7 /100 | #138 | Excellent 56.3% |